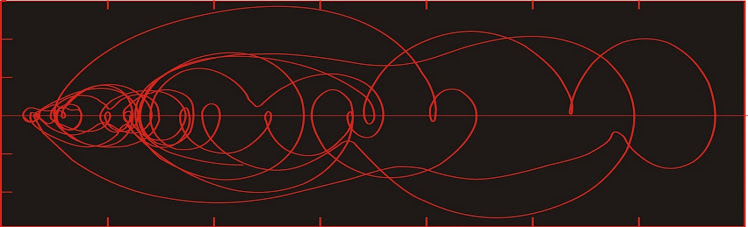
Dust flux, Vostok ice core

Dust flux, Vostok ice core
Two dimensional phase space reconstruction of dust flux from the Vostok core over the period 186-4 ka using the time derivative method. Dust flux on the x-axis, rate of change is on the y-axis. From Gipp (2001).

Wednesday, September 25, 2013

The tipping point of 2008

As before, I have compiled this graph from official figures released by BLS and the US Fed.


Scatterplot of unemployment rate vs real interest rate (3-mo. treauries - inflation).

As some commentators have noted, the fall in unemployment rate is not supported by the fall in labor force participation, and it is likely that unemployment is understated because of the large number of individuals who have become discouraged.

In any event, we see a major change happened in late 2008, accompanied by a short-lived spike in real interest rate (mainly due to falling prices). Since then, interest rates have been slammed to real lows, but the unemployment rate has not significantly changed.

The transition from the lower area of concentration to the higher one is an example of a state change in a complex system. The system has switched from one mode of operation to another.

What are the two modes of operation? We can assume that one of them is an ideal economy in which most of the players are involved in some sort of productive enterprise. It is this economy which behaves more-or-less as predicted by economists--a drop in interest rates tends to cause a marginal increase in productive investment.

The trouble is that over the past couple of decades, an increasingly large proportion of economic activity was based on non-productive, or rent-seeking, activities--such as speculation, carry trades, and increased fees for normal financial activity. When the financial crisis hit in 2008, guess which sector received the majority of aid from central banking authorities. It wasn't the productive sector--it was the speculative sector. When you consistently reward an activity, you get more of it. At the same time, the productive sector suffered real damage, and contracted to the point where the US economy is now dominated by rent-seeking behaviour.

In an economy of speculation, lowering interest rates does nothing but reward further speculation (near bottom). If you can borrow ever-increasing amounts of money at near-zero interest, and make progressively larger bets on the global casino until it pays out, then why would you do something risky like build a factory to make refrigerators?

Since the lower interest rates aren't creating employment, the BLS has no choice but to keep removing discouraged workers from the list. It's the only way to reduce unemployment.

Well, keep pushing boys--eventually you'll get that unemployment "rate" down to 6% and you can claim mission accomplished--no matter what the real state of the economy.

Tuesday, September 24, 2013

Is war really the health of the State?

I've just started looking at this paper (link corrected) by Turchin et al. (2013) (model results here). The basic premise is that the organization of humanity from small hunter-gatherer tribes into cohesive states was driven by intense competition between neighbouring groups--such competition being in the form of warfare. Cultures which developed superior military technology (cavalry, chariots, strategy) defeated their neighbours, which then either adopted the culture or were annihilated.

The model was run on a realistic landscape of the Afro-Eurasian landmass, and the authors claim that the results mirror the historical record nicely, suggesting that war and geography are the key controls on the development of the nation-state.

All figures below come from the Turchin et al. (2013) paper.


Imperial density map (visual likelihood that any particular 100x100 cell 
was occupied by part of a large-scale political unit) during time-slices from 
1500 BCE to 1500 CE.

I'd like to put together a more detailed critique in the future when I have a little more to digest it. My first impression of the model output is that I am not as optimistic about the model as are the authors. To me, it looks like the real world is a lot more culturally cohesive than any of their model outputs.


Imperial density map for 500-1500 CE. History (at left) vs. the model (right).

Reality is richer than the model (it usually is), although the model better matched history in earlier time-slices. I think the authors' world view is somewhat bleak, but admit that it is probably a fairly good explanation in the earliest stages of human history. In later stages, I think cooperative trade played a much larger role the transmission of cultural norms and the formation of large states.

h/t Non Equilibrium Social Science

Reference:

Turchin, P., Currie, T. E., Turner, E. A. L., and Gavrilets, S., 2013. War, space, and the evolution of Old World complex societies. Proceedings of the National Academy of Sciences, early edition (Sept. 23, 2013). doi: 10.1073/pnas.1308825110

Sunday, September 22, 2013

Why do Ma and Pa play in a rigged market?

“They have been able to pay off politicians with political campaign funds and have been granted informal and unspoken yet complete immunity from prosecution, setting the scene for even bigger confiscations of investor capital. With the risk of legal repercussions so small and the temptation to steal so large, why would any of them not take advantage? What do they have to do to stop people from entrusting them with their savings? Put up neon signs that say, “We steal your money”?”
                                        – Dimitri Orlov – The Five Stages of Collapse

Sometimes even that doesn't help.


"Darn it, Pa! I told ya not ta buy AAPL on margin!"
"But Ma, I thought you wuz talkin' 'bout apples."

The problem is that Ma and Pa believe they are above average--in intellect, in wisdom, in luck, in investing acumen. When they see that sign that says their money will be stolen, they all have faith that it will happen to somebody else.

When I was a kid, I wanted to be a pool shark. Never mind that I wasn't much good at it. I researched the concept at the local magazine stand and discovered that the secret was not to beat the other guy with great shooting, but to beat him in a way that he would think he had beat himself, through mistakes. The reason it works is because when your victim makes a good shot, he believes that is his normal capability, but a mistake is not--and tends to be discounted. That discounting is essential, because if your victim believes he only lost because of his own mistakes, he will be confident he will win the next time. On the other hand, if you simply run the table, chances are he won't play again.

This only works because people are usually not as clever as they think they are.

Consequently, Ma and Pa can read about what is being done to them--and they will think it is only a problem for other people. Their orders will get filled in a timely fashion. The stocks they buy have true liquidity--not the phantom liquidity of offers that are never to be filled. And when they file for bankruptcy, it will merely have been bad luck.

Friday, September 20, 2013

What's in a bubble?

Bubbles are on a lot of minds lately. Bonds. Housing. Stocks. Are any of these in a bubble? How do we decide? A bubble is usually defined as a situation in which the value of an asset exceeds its true worth. What does that mean? How are we to know that the true worth of something differs from its price? It sounds like something St. Thomas Aquinas would think up.


Here is a reconstructed phase space of what is generally agreed to be a popping bubble--the Case-Shiller index. It's not always clear when the popping takes place. Is it the moment it falls from a high to which it never returns (or at least not for a considerable time)? That's first quarter, 2006 in the above figure. Is it when it becomes clear that no area of stability is going to form in the upper registers of phase space? That would be about the second quarter of 2008 in the above figure. Or is it only when the system returns to the area of stability that characterized it? That hasn't happened yet, but it looks imminent.

For today's discussion, consider the S&P 500 and the price of gold.


"Oy'm winning," sez S&P. Data here and here.

Starting from a remarkably similar starting point, they have reached pretty similar levels. But although the S&P 500 may be slightly ahead over our 20+ year chart, it hasn't always been so. In fact it is painfully obvious in hindsight that switching from stocks to gold in early 2000 would have been especially sweet.

One approach I have been working on is based on the notion of stability. It looks good for the Case-Shiller index at top, but that index has been adjusted for inflation--the gold price and the S&P 500 are not. We may be able to assess stability by reconstructing state spaces from the original time series.


Apart from the run-up in price over the past 20 years, the main feature on this graph is that the plot does not stray far from the green dashed line, which is the only part of the graph where areas of stability can appear. Apart from the cluster at about $300, there aren't any areas of stability. I'm not alarmed by this, and don't expect the $300 area to come into play again. This is a reminder of the importance of adjusting for inflation.


Even though this graph is also not corrected for inflation, it does not behave as the gold chart does, but cycles twice around the yellow dashed circle. In terms of a deviation from the regions of stability, it did get about as stretched as did the housing market, both in January 1998 and November 1999. It's current position is not stable but it is not nearly as extreme as it has been in the past.

Some have suggested that gold price is a proxy for inflation. So let's look at the S&P 500 with respect to gold. The comparison will be as follows: the difference between the S&P and the gold price, divided by the gold price.


Here we see a tremendous peak in early 2000. The current level of the index, however, does not seem out of line with respect to gold. If the S&P 500 is in a bubble, then so is gold.

Both the stock market and the dollar price of gold are influenced by monetary creation. As long as money continues to be created, we should expect both to increase in price. There have been times in the past when the money blew up the stock market much more rapidly than gold, and if that were to happen again, there may be an arbitrage opportunity. Such does not appear to be the case today. I find it hard to imagine that we will see the extremes of early 2000 again.

In a time of monetary or credit creation, there are opportunities to preserve wealth through investments in productive enterprises as well as gold. Unfortunately, it is difficult to distinguish between enterprises that are truly productive and those which merely look productive as long as the credits keep flowing.

Tuesday, September 17, 2013

Dissection of the Malian crisis

An detailed summary of the crisis in Mali from inception to the present has been recently released by the Institute for the Study of Islamic Thought, and is presented here. (pdf)

What I found striking is that prior to the turmoil, Mali had passed through about 20 peaceful years, including five elections and three peaceful transitions of power. The speed with which the collapse occurred was surprising, and may be an object lesson in the stability of African democracies.