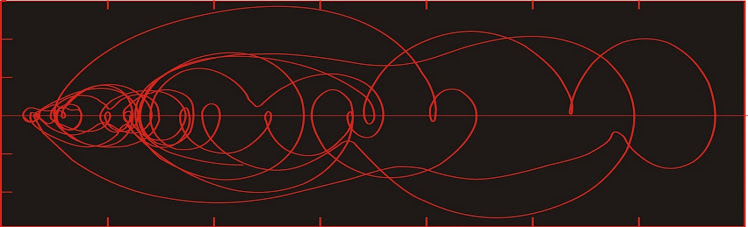
Dust flux, Vostok ice core

Dust flux, Vostok ice core
Two dimensional phase space reconstruction of dust flux from the Vostok core over the period 186-4 ka using the time derivative method. Dust flux on the x-axis, rate of change is on the y-axis. From Gipp (2001).

Thursday, March 6, 2014

The PDAC experience, part three

My son was playing around with the various pens I brought back from various companies. I use PDAC to stock up.

Clearly I need to start doing more due diligence.

My son got all of the pens to work except one: Detour Gold. So, naturally we took it apart to have a look.
Nice looking pen!


So far, so good.


Aha! No pen tip, no ink reservoir--just an empty shell.

You may insert your own punch line here.

I currently have no position in Detour, although I admit I did very well on it in the past.

Wednesday, March 5, 2014

Just noticed the Fraser Institute has its latest publication on mining jurisdictions, but haven't had time to go through it yet. pdf here.

Too bad they didn't ask me for an opinion on Sierra Leone.

PDAC, part deux

Now that the beer fog has cleared somewhat, here are some other observations.

Compared to previous years, the place was dead. Sure, there were people shuffling around. But I had broken a toe on Saturday in an unrelated event, and was a little nervous about getting it stepped on in the crowds (which would have been a given in any of the last three years). But I had no problems on Tuesday--in fact I hardly needed to exercise any vigilance at all, because the aisles seemed quite a bit wider than usual (fewer booths by far), and there were several booths missing at the ends of the crossways, so they were wider too. And there just weren't that many people there.

In other good news, somebody out of the blue asked me to do some work for them. I hadn't planned to look for any work, figuring it was probably pointless, at least among the companies that did show up.

There was a rumour that about 100 companies that had registered to have booths at the investor's exchange didn't bother coming.

These points seem to suggest we are close to a bottom in psychology--and the few financings that have occurred, and someone asking me if I could do some work for them, both point to an improving market. Unfortunately, my gut tells me that not enough bad companies died during the downturn.

One last point of interest--I was talking to a mining securities lawyer acquaintance of mine in one of the hospitality suites and I got to discussing one of my favourite topics--the manner in which NI 43-101 regulations skew the market in favour of larger interests, particularly institutional investors (to the detriment of the retail investor). It didn't surprise me that he agreed with me. It was the way he agreed with me. "Well, duh!". He did suggest that if the retail investor wants to front-run the market like a bank, then let him hire his own team of geos.

Tuesday, March 4, 2014

My day at PDAC

Truth to tell, the only incident I remember was being accosted by some kid in front of the Barkerville booth. He shoved a pamphlet at me, boasting that "the company had just started operating its mill yesterday." Furthermore they were going to produce some amount of gold which I've had too much beer to remember, and am too lazy in any case to look up or even direct you to the website.

So I asked him, "What do I get to do to you if the company doesn't deliver?" He looked slightly alarmed and confused. He asked what I meant. "Well, suppose I buy shares in this company on your recommendation, but the company fails to deliver on these promises, and I lose money. What do I get to do to you?" He took a couple of steps back, and started looking wildly around, possibly for Security. "Are you implying that all I can do is sell my shares?" He was like a drowning man thrown a lifeline. "Yes! You can sell your shares!"

"That won't be cathartic enough," I told him.

Over lunch I thought about what sorts of remedies there should be for disgruntled shareholders. It's unlikely they'd ever be allowed to physically injure anybody, but one idea that occurred to me was that for each board lot should entitle you to one sledge-hammer blow on the CEO's car. Now, it's true that after 50 or so such blows, the car would be a write-off, and the next 14,950 or so shareholder hammer-blows would technically be wasted, but may be cathartic. So that will be my next recommendation to the compliance officer at the OSC.

Monday, March 3, 2014

More about bubbles

Today we revisit a ratio I last looked at late last year--a simple comparison of the S&P500 vs gold, based on monthly closing prices, going back to the late '70s. In keeping with the theme of this blog, it has been presented in phase space. One way of studying complex systems is to attempt to illustrate the space of vectors that drive its evolution through time by observing the trajectory traced out in phase space. The time-delay phase space plot is one approach.


The S&P500-gold function is obtained by subtracting the gold price from the S&P 500 index price and dividing the result by the lesser of the gold price and the S&P 500 index. I did it in order to balance the size of the two bubblicious lobes that appear in the diagram.

The present value of the function is plotted on the vertical axis; whereas the 18-month lagged value plots on the horizontal axis. As the trajectory is placed out by the succession of points on the graph, when the trajectory is rising, the S&P 500 is outperforming gold; and when falling, gold is outperforming the S&P 500.

The downward bubble represents the rise and fall of the gold price in the late '70s to the early '80s, and lasted eight years. The upward bubble traces the rise and fall of the S&P 500 through the late '90s until 2009, and represents about 14 years. Together, the two bubbles constitute 22 years, which is more than half of the time represented by the plot.

Much of the time is spent close to the origin, meaning much of the time, gold and the S&P 500 index don't blow up with respect to one another. They still represent differences in performance of a few percentage points, and totalled over the 40 years of the graph, such differences will still be material. You might also notice that August 2011 plots just below and to the right of the origin, while December 2013 plots just above and to the left of the origin. Although not far apart on this graph, that did represent a pretty painful time for goldbugs.

Once a generation there appears to be a tremendous opportunity to make money. But the money is only made if you are able to keep it. It isn't enough to ride the bubble to the top--you need to take profits near the peak and there are opportunities during its deflation.

As we are again near the origin, there is no sign of a bubble in either of these parameters with respect to one another. If there is to be another vast bubble, we can't yet see which one is going to be inflated. But if we're taking turns, then it's gold's turn.