A good deal of the statistical description of populations is based on the normal distribution. I think this is because the first things we tend to notice (the variability of sizes of people and animals) tend to have such a distribution. The height of Canadian men averages about 1.74 m, and the probability of variance typically follows a bell curve such that the probability of a man being 2.1 m tall, for instance, is much lower than the probability of being 2.0 m tall. There are well-established physiographic reasons for why people will not be much taller, (or very much shorter, discounting factors such as amputations), so that we can discount the existence of 3.5 m tall men.
One way of displaying the normal distribution was through a normal probability plot, which is a graph in which the vertical axis is scaled so that cumulative probability (for a normal distribution) will plot as a straight line. There is special graph paper you can use, with an appropriately scaled vertical axis, variably called probability paper, or probability plotting paper (pdf). A description of its use with data appears here (pdf).
If we are looking at natural phenomena with a wide variety, it is likely the distribution will be log-normal.
A normal distribution is described well by a mean and a standard deviation. If we plot probability density, we observe a parabola, with the maximum probability density corresponding to the mean.
The concept of the normal distribution was so powerful that we naturally carried the description to describe other phenomena, for which there are no such limits on size. Landslides, for instance, like the current one in Washington state, or earthquakes. Our current understanding of such events is that they exhibit scale invariance, which means that there are normally many more small events than large events, and the frequency of larger events is related to the frequency of the smaller events through their size on a logarithmic scale. In particular, the size-frequency distribution is a straight line on a logarithmic scale.

As the economic value shapes whether or not an accumulation of mineral is considered a deposit, mineral deposits only show scale invariance over a limited range. The numbers of, say 50-oz accumulations of gold in nature are extremely large, but these are very unlikely to be of economic interest. On the other hand, 50-million-ounce accumulations are much more rare, but are far more likely to be economically viable, and are thus more likely to constitute a "deposit". The size-distribution of deposits is controlled by these two contrasting probabilities, and the resulting distribution is log-hyperbolic. The probability density graph appears to be an hyperbola.

Hyperbola, parabola, what's the difference. Well, the differences are slight over much of the probability density plot, except at the tails. Of course, those tend to be the most memorable events (well, at the large tail).

Perhaps this doesn't look too impressive to you. But the differences in the tails can be extreme, especially for the most extreme events. The reason is that although the magnitudes of the slopes of both curves increases as you move away from the centre, in the case of the hyperbolic distribution, the maximum value of the slope approaches the slopes of the guiding lines (the asymptotes), whereas the slope of the parabola increases without limit. The discrepancy in estimated probabilities for extreme events can be orders of magnitude!
This is a possible explanation of the "fat-tails" problem that comes up from time to time in discussing extreme events (recent economic events for instance). IIRC, the failure of Long-term Capital Management had been estimated as extremely unlikely, as the risk model showed a maximum daily loss of $35 million. Losses eventually greatly exceeded the model maximum.
The implications of this distribution is happier for geologists--it means the probability of discovering a large deposit is larger than is frequently assumed.
For instance, this is from what appears to be a Shell-training document (large pdf) on the role of play-based exploration in the decision-making tree (image is on pg 45).
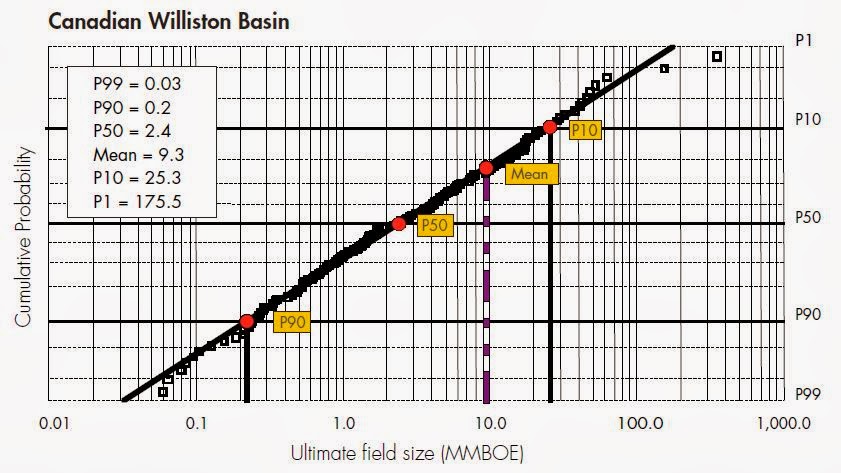
The straight line is the log-normal distribution fit to the observations (squares). The model fit predicts that only 1% of discoveries will be larger than 175.5 million barrels of oil equivalent--but the observed data suggests that about 1.5% of discoveries are greater than about 350 million barrels.
Using the model to estimate the probability of a large discovery probably satisfies the accountants as being nice and conservative, but considering the potential economic importance of individual large discoveries, using the incorrect probability model may create a significant opportunity cost, if it results in an area play being discarded incorrectly.
I know some folks in the oil industry--and they can be a cagey lot, especially about something that influences their business plan. So it wouldn't be unheard of for the above document (as it is publicly available) to be deliberate misinformation. I have made enquiries, but so far no one will admit to knowing what I'm talking about.
Anyway, the play-based exploration idea is something I alluded to last time--but I don't see this entering into the playbook for mining companies until the costs of failure for mining exploration more closely resembles that of petroleum exploration--something that I think is still a few decades away.
One way of displaying the normal distribution was through a normal probability plot, which is a graph in which the vertical axis is scaled so that cumulative probability (for a normal distribution) will plot as a straight line. There is special graph paper you can use, with an appropriately scaled vertical axis, variably called probability paper, or probability plotting paper (pdf). A description of its use with data appears here (pdf).
If we are looking at natural phenomena with a wide variety, it is likely the distribution will be log-normal.
A normal distribution is described well by a mean and a standard deviation. If we plot probability density, we observe a parabola, with the maximum probability density corresponding to the mean.
The concept of the normal distribution was so powerful that we naturally carried the description to describe other phenomena, for which there are no such limits on size. Landslides, for instance, like the current one in Washington state, or earthquakes. Our current understanding of such events is that they exhibit scale invariance, which means that there are normally many more small events than large events, and the frequency of larger events is related to the frequency of the smaller events through their size on a logarithmic scale. In particular, the size-frequency distribution is a straight line on a logarithmic scale.
As the economic value shapes whether or not an accumulation of mineral is considered a deposit, mineral deposits only show scale invariance over a limited range. The numbers of, say 50-oz accumulations of gold in nature are extremely large, but these are very unlikely to be of economic interest. On the other hand, 50-million-ounce accumulations are much more rare, but are far more likely to be economically viable, and are thus more likely to constitute a "deposit". The size-distribution of deposits is controlled by these two contrasting probabilities, and the resulting distribution is log-hyperbolic. The probability density graph appears to be an hyperbola.
Perhaps this doesn't look too impressive to you. But the differences in the tails can be extreme, especially for the most extreme events. The reason is that although the magnitudes of the slopes of both curves increases as you move away from the centre, in the case of the hyperbolic distribution, the maximum value of the slope approaches the slopes of the guiding lines (the asymptotes), whereas the slope of the parabola increases without limit. The discrepancy in estimated probabilities for extreme events can be orders of magnitude!
This is a possible explanation of the "fat-tails" problem that comes up from time to time in discussing extreme events (recent economic events for instance). IIRC, the failure of Long-term Capital Management had been estimated as extremely unlikely, as the risk model showed a maximum daily loss of $35 million. Losses eventually greatly exceeded the model maximum.
The implications of this distribution is happier for geologists--it means the probability of discovering a large deposit is larger than is frequently assumed.
For instance, this is from what appears to be a Shell-training document (large pdf) on the role of play-based exploration in the decision-making tree (image is on pg 45).
The straight line is the log-normal distribution fit to the observations (squares). The model fit predicts that only 1% of discoveries will be larger than 175.5 million barrels of oil equivalent--but the observed data suggests that about 1.5% of discoveries are greater than about 350 million barrels.
Using the model to estimate the probability of a large discovery probably satisfies the accountants as being nice and conservative, but considering the potential economic importance of individual large discoveries, using the incorrect probability model may create a significant opportunity cost, if it results in an area play being discarded incorrectly.
I know some folks in the oil industry--and they can be a cagey lot, especially about something that influences their business plan. So it wouldn't be unheard of for the above document (as it is publicly available) to be deliberate misinformation. I have made enquiries, but so far no one will admit to knowing what I'm talking about.
Anyway, the play-based exploration idea is something I alluded to last time--but I don't see this entering into the playbook for mining companies until the costs of failure for mining exploration more closely resembles that of petroleum exploration--something that I think is still a few decades away.


