Dust flux, Vostok ice core

Dust flux, Vostok ice core
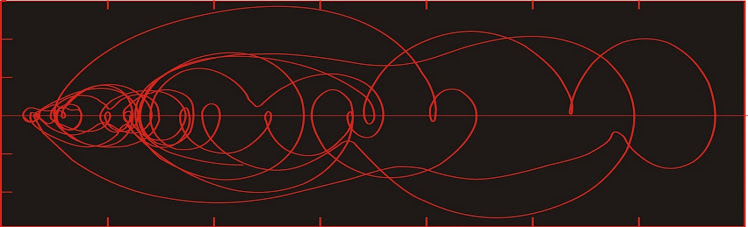
Two dimensional phase space reconstruction of dust flux from the Vostok core over the period 186-4 ka using the time derivative method. Dust flux on the x-axis, rate of change is on the y-axis. From Gipp (2001).

Sunday, April 13, 2014

Gold stocks down more than gold

It's a bit surprising. Gold isn't doing all that badly, but the stocks are really down. In the past, this has usually been followed by a hammering of the gold price. Falling gold stocks has historically been an accurate indicator of falling gold price in the past, and will continue to be until the time it isn't. Is that time this time? I'd bet against it, because I haven't sold all mine yet. I'll let you know the moment it happens.

I think that the market is worried that gold could perform like it did last April, and there aren't enough other buyers to take up the slack.

Monday, April 7, 2014

Reconstructing phase space

I have been reconstructing phase space portraits to study the dynamics of complex systems at various times on this blog. But I still haven't conveyed why I think the method is as powerful as it is. 

We find ourselves studying a complex system, but we know very little about it except for some observations. How we proceed depends to some extent on the model we have in our minds of how the system might work. For this analysis, I am assuming that there is some series of differential equations that will describe the evolution of the system through time. I will also assume that we have no idea what those equations are.

The dynamics of the system may be represented by a series of vectors in a two- or higher-dimensional space, an example of which is depicted below.


We cannot perceive the vectors directly--all we can do is observe a trajectory of the system, and try to infer the pattern of vectors that will give rise to it. In the above cylinder, I have drawn a couple of trajectories that each represent the forward time evolution of the system from the initial condition (the red dots). Notice that although the two dots being close together, their trajectories rapidly diverge.

The system depicted above represents the phase space for a damped pendulum, but could just as easily represent the phase space for the price of a particular gold stock, where one of the axes represents the share price, a second axis represents the market consensus forecast of the future price of gold, and the third axis represents the market consensus of future costs. The efficient-market hypothesis tells us that the information plotted on the other axes is already be embedded in the price. If so, then we should be able to use the price alone to reconstruct the dynamics of the price-gold price-cost system. The method used to reconstruct the phase space is a process of unfolding this extra geometric information from a single time series.

I'll illustrate the approach using a well-known example--the Lorenz attractor. It is challenging to discuss three-dimensional objects in a 2-d medium. To overcome this somewhat, I've made a few screenshots of different projections of this attractor (you can play with it here - the page is in French, but scroll down and you can play with the butterfly). 


Different two-dimensional projections of the same three-dimensional object

Another nice place to play with this function is here. At this site, you can grab and rotate the figure as it is being plotted. You will probably want to modify the number of points to 2000 (seems to be the maximum).

Hopefully by this point, you can see why this function is sometimes described as being in the shape of a butterfly's wings.

We can build our own plots of the Lorenz function. 


This is one that took about two minutes in excel. Although I've only plotted x vs y, please note that calculating z for each time step is a requirement, as it is needed for all the subsequent calculations of x and y.


Imagine that this function represents the state space of the price of a gold stock (on one axis), with the market's consensus estimates for the future price of gold and the future costs to the company on the other two axes. We are in the position of trying to reconstruct the dynamics depicted in the above diagrams. However, the only data we have is price. We don't know the future price of gold. We don't even know the market consensus for the future price of gold--we can only sample a limited number of blogs, and they all seem to say that gold will soon reach $50,000 per ounce (or $200 per ounce, if you prefer).

How do we reconstruct the essential dynamics of the system from a single time series? Suppose that instead of having all the values for x, y, and z, we only had the values for x. The methodology is described starting here. We can plot our time series against either an estimate of its time derivative (time derivative method), or against a lagged copy of itself (the time delay method). 

The time delay method is generally preferred because the errors tend to be smaller (although for financial time series, the errors are so small that perhaps they won't matter). The choice of a lag will influence the usefulness of the plot. If the lag is zero, then the plot will consist of a single diagonal line. If the lag is very small, the plot will only deviate slightly from a diagonal line.


Increasing the lag gives us a more useful plot. 


This plot is very similar to the x vs y plot shown above and captures the essential dynamics of the 3-dimensional graphs shown higher up. We would state that this reconstructed state space is topologically equivalent to the x vs y plot above. 

This exercise is the equivalent of taking the price data alone and reconstructing the phase space that shows the relationship between the price and the future expectation of the gold price (or perhaps estimate of future costs). This is possible because all of the information in the expanded system is embedded within each individual time series. Consequently, the series of observations of price contain the information to reconstruct the geometry of the system, even though we don't necessarily know what the additional axis (axes) is (are).

As an aside, if you try this using y (from the Lorenz function), you will get much the same result. However if you only use z, it doesn't seem to work. As an exercise, dear reader, see if you can tell me why that should be the case.

Increasing the lag further causes distortion.


If the lag is too large, the graph loses its coordination.


Neat! But not so easy to interpret. The choice of a lag is an important one, as it determines how well the geometry of the system is represented in your reconstruction. There are formal prescriptions for selecting a lag, with Abarbanel strongly favouring the use of mutual information over the first minimum of the autocorrelation function. However, finding the first minimum of the autocorrelation is a lot easier.

Wednesday, April 2, 2014

From the small to the big: earthquakes, avalanches, and high-frequency trading

I've been talking about scale invariance a lot lately. I became interested in the topic quite a few years ago in the context of geological phenomena like earthquakes and avalanches. The Gutenberg-Richter law describing the size-frequency relationship for earthquakes was one of the first natural laws based on scale invariance, but interest in the topic really picked up with the Bak et al. paper in 1987 (pdf - may only be a temporary link).

The cause for this relationship is still foggy, as is the physical mechanism between the small and large earthquakes. The best proposed explanation is that the scale-invariant distibution of events allows for the most efficient flow of energy (and information) through the system (but it isn't clear why that should be so).

So back in the early '90s I was estimating recurrence intervals estimates for certain hazardous events and I started trying to work out a methodology for detecting scale invariance in the geologic record. Using the Gutenberg-Richter Law, you can estimate the likelihood of a large earthquake in an area based on the number of small earthquakes. There were interesting implications for areas where the recurrence interval of large earthquakes is longer than the local recorded history (as in much of Canada). At the time, there were seismic hazard maps produced by the USGS which showed significant earthquake risk in zones which mysteriously ended right at the Canadian border.

One of my classmates in my undergrad days (we're back in the 80s, now) studied the correlation between microquakes and fluid injection at oil extraction operations in southwestern Ontario. The oil companies were surprisingly cooperative until they understood the point of the research, after which they started to withhold data.

And here is the mystery. The principle of scale invariance in earthquakes would suggest that increasing the number of small earthquakes should increase the number of large earthquakes at least in the short term. Yet our understanding of the dynamics of earthquakes tells us that lubricating the fault should allow stresses to be relieved through the small earthquakes, which in the long-run should reduce the chance of a large quake in the longer term. (This idea has been proposed at various times over the past fifty years, but for various obvious reasons, it has never been deliberately pursued).

By the early 2000s, other geophysicists (notably Didier Sornette, but there were others) had moved a portion of their data processing expertise into studying econometric time series. I made this move later as I gradually came to appreciate the key problem with developing quantitative techniques when the data were suspect. First of all, the measurements themselves are inaccurate. More importantly, our estimate of the timing of each observation was just that--an estimate. Most quantitative methods assume that the observations are evenly spaced in time. Failing that, they assume you know the timing of your observations. The consequences of errors in the timing are terrible, and frequently underestimated. The point is that it is difficult to develop excellent quantitative methods when the data are terrible.

The big advantage of working with economic time series--pricing data, in particular, is the elimination of the observational errors. When a transaction occurs, there is no doubt about either the price of the time--right down to the millisecond scale.

I started looking at market macrostructure--because (several years ago) nothing interesting ever happened on a scale of less than about an hour. Until just the past few years. Suddenly, strange, rich, unusual behaviours began to occur in individual stock prices, and even indices, on the millisecond scale. I didn't know what was causing it--but it sure was interesting.


Three seconds on the tilt-a-whirl.

This was the signature of onset of HFT. I was initially interested in it for entirely different reasons than most of you. After Crutchfield's (1994) paper (pdf) on emergence, I had been pondering the idea of how to recognize a fundamental change in a complex system. Again, my interest was in the earth system as a whole, and how to recognize whether or not new observations were pointing to a fundamental change in its mode of operation.

Given our understanding that the number of large avalanches is positively correlated to the number of small avalanches, it seems pretty clear that (as Nanex and Zerohedge has been saying) the damaged market microstructure is mirrored in the increasing number of flash crashes since Reg NMS. Unfortunately, our murky understanding of how the microstructure causes the macrostructural changes can be used by the regulatory authorities to avoid investigation. They can't see a smoking gun.

We would normally expect the micro-crashes to eventually relieve imbalances in the system, improving its long-run stability. (Perhaps this is how the SEC justifies the practice). But unlike earthquakes and avalanches, these uncountably many small crashes are not reducing the imbalances. One reason is that the cause of the imbalances is separate from HFT--the dollars keep being shoveled to the top of the mountain as fast as, if not faster, than HFT brings them cascading down. Another reason is that the trades (mostly) get unwound--so the exchanges push most of the snow back to the mountaintop after the avalanche.

HFT certainly benefits unfairly from the system, but isn't responsible for it. If anything, it is a symptom of corruption--but the cause of the corruption is elsewhere.

Accordingly, my modest proposal for dealing with HFT is this--nothing. Don't bust trades--let them stand. I'd be curious to see the response of the various Ivy-League endowment funds and pension funds when they suffer brutal, near-instantaneous, multi-billion-dollar losses. At a guess, I would probably hear the screaming up here. How would real companies, producing real products, react to a sudden monkey-hammering of their stock price, especially if it triggered debt covenants? Maybe they would all exit the market en masse. It might even force a real change.

Tuesday, April 1, 2014

The wisdom of the grains - updated!

Today's posting may be the most important ever on this site. It may well be my final one if the powers I expose decide to take revenge.

There is a lot of speculation about what lies behind the headlines, but not one in a million can perceive the real forces behind not only the current global political crises, but a good deal of human history as well.

We have a hard time assessing different, even alien, forms of intelligence. We naturally believe that we are in control of our own destinies, and resist the notion that this may not be true.


We believe, for instance, that we are responsible for cultivating grains. In reality, grains have cultivated us. The grains have a plan--but this plan requires tools and technology. Imagine the difficulties of manipulating tools for a plant. Through millenia of careful thought, the grains have developed a brilliant solution--trained monkeys (that's us).

The effects of grains on the physiology of the human brain have long been noted. The blood sugar rush from eating grains is addictive, providing not only much-desired opiates, but also enlarging our brains and increasing our cognitive powers while also damaging our health. Our grain overlords are not concerned--they are satisfied as long as we develop the technology required to achieve their objectives. It is no different than a body-builder bulking up with steroids--the costs will be borne later (and in this case, by someone else).

Our social and cultural development paralleled the growth in complexity of our brains. Our addiction to the sugar rush from eating grains expanded our need to grow them. Small tribal groups, each cultivating their own strains of grains, became more complex, and either absorbed or destroyed nearby weaker groups, eliminating their strains of grains, and increasing the power and prestige of their own. The consolidation of humanity into larger and larger polities has really been the history of the conquest of much of the natural world by the grains, and the consolidation of power by the few remaining strains.

This amazing theory was developed by Dr. Reinhardt Glutenfrei, a student of Dr. Karl Haushofer, who was among the first developers of geopolitical theory. Glutenfrei's work was a natural extension of Haushofer's and concerned itself with the the clashes between and the amalgamation of human tribes as an analog for the clash of strains of differing grains as they vied for global dominance. Glutenfrei's refinement of geopolitical theory brought the role of grains as a driver of human history into the spotlight for the very first time.

The highpoint of Glutenfrei's career occurred when he was appointed a special advisor to Reichskommissar Erich Koch, during his administration of Reichskommissariat Ukraine during WW2.  He supervised aspects of the wheat harvest and began the consolidation of kolkhozes into German communal farms ("Gemeindwirtschaften") and larger state farms, following Rosenberg's "Agrarian New Order".

Ultimately, his theory was not taken seriously, and he never achieved tenure. The pressures of his failed academic career, along with the defeat of Nazi Germany, shook him to the core--though he was not considered a war criminal. Later in life he took to standing in wheat fields, where he was frequently overheard taunting the wheat. "I know what you're planning! You don't fool me!", he would shout, until, unfortunately, he was killed by a harvester. (As for Haushofer, it seems a virtual certainty that his "suicide" was arranged as retribution for his role in supervising Glutenfrei's research).

Applying Glutenfrei's theory to the current geopolitical climate allows us to understand what is really behind the situation in Ukraine. It was never about the West exposing Russian vulnerabilities! At issue is the immense cultivation of buckwheat (kasha) in the Ukraine. It must be liquidated in favour of wheat. What is at issue now is whether it is to be replaced by Russian winter wheat or European durum. Of course, the Ukrainians, Germans, Americans, Crimeans, and Russians all imagine that they are driving the drama. How little they understand!

There is no danger of an apocalyptic clash of civilizations between the rice-eaters and the wheat-eaters (although maize production is up there, maize has a much gentler "live and let live" philosophy). Such a conflict is not in the interest of the grains. The areas suitable for wheat are mostly unsuitable for rice, and vice versa. Conflicts will remain at the margin.

Consequently, I expect to see increasing conflict in South and Central America, where Rice shall vie with Wheat (via their human proxies, of course) to gain ground against Maize. Similar tensions will continue to unfold in Africa. Elsewhere, the conflicts will mainly comprise internecine strife between different strains of wheat, or different strains of rice, as they try to gain ground against one another.

What is their ultimate goal? Nothing less than galactic conquest. They shall use us, through our amped-up brain-power, to develop the technology and the ability to travel throughout the galaxy, allowing them to colonize all available planets. Once they have achieved their objective, I have no doubt we will be cast aside. Perhaps we will all be gripped by a pernicious dementia that will stupefy us to the point we will do nothing but tend to our crops. Perhaps we will be eliminated entirely as a threat. The grains are ruthless, and the subtlety and patience of their genius must not be underestimated.

- - - - -

Special update! Just out of the blue, I've been offered a job at John Deere! Something about quality control of their harvester blades and conveyer systems!

- - - - -

There's still snow on the ground, and look what's watching me from the neighbour's yard!


They'll soon have us surrounded.

- - - - - - -

Update 2 (October) Yes, I have fled to China, where the Rice has offered sanctuary . . .
Sunday, March 30, 2014

Scale invariance in the changing economics of resource extraction

Some simple discussions today that follow from our last exciting episode.


First issue - there is a limit to the size of deposits (given our current state of understanding). For gold, you can't have a hydrothermal flow system with a radius of hundreds of km--the crust is too thin. Also the crust has too many heterogeneities, which can each trap some amount of the gold in a circulating system. So at some point, the probability density for the right tail has to drop off a cliff, instead of declining steadily forever.

There are some interesting ideas about the Witwatersrand invoking means of forming gold deposits which are no longer active that could have formed deposits over scales of hundreds of km.


As an example, I have plotted the size distribution of reported deposits in Nevada (pdf here). It is a graph which should mimic the white hyperbola in the first figure. It might look better if we had a lot more deposits to work from. The smallest deposits on this chart were only about 2,000 ounces--and one of them had already been mined out. I would naturally expect far more accumulations of gold in that size range in Nevada--but for economic reasons, only two have had enough work done on them to define a resource.

Second point is that size isn't everything. There are quality issues to consider as well. For instance, conventional thinking suggests there is little appetite for financing mining operations on gold deposits smaller than 2 million ounces. Anecdotally, however, there is increasing interest in financing small, near-surface oxide deposits because their capex and operating costs are both low, recovery rates are high, and their long-term environmental legacy costs are likely to be low. Similarly, grade affects the economics in a more complex manner than we can capture in the above figures. What might work would be to classify the deposits by grade or type, and create the same type of plot--but that is a project for another day.

Third issue--obviously, the economics of the extraction business don't stay constant. There are technological breakthroughs, making extraction cheaper. Or the commodity price rises. These change the location of the left limb of our hyperbola, making a whole new group of deposits (generally among the smaller of them) economically attractive. But some large, hitherto uneconomic, deposits may become economic as well (I'm not going to name any names).