Dust flux, Vostok ice core

Dust flux, Vostok ice core
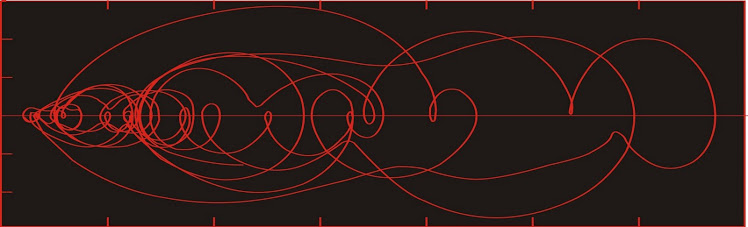
Two dimensional phase space reconstruction of dust flux from the Vostok core over the period 186-4 ka using the time derivative method. Dust flux on the x-axis, rate of change is on the y-axis. From Gipp (2001).

Monday, August 9, 2010

How Life Imitates the Stock Market* part 1

Many of the really interesting parts of the world are now recognized as exhibiting complex behaviour. If we use the simplest definition as described in here, that suggests that it is unpredictable. We now recognize that one of the elements of complexity is the emergence of complex behaviour within a system that is actually described by simple equations (even if we don't know what those are). As described in earlier posts, these systems may be studied in a parameter space defined either by the original data set plotted against its time derivative, or a lagged data plot.

Today I will try to justify my assertion that the stock market shows many of the properties of complex systems. In order to show the typical behaviour of such a system, let us consider the climate system.

The particular component we will look at is the deep ocean delta O-18 record, which is a proxy for global ice volume. By O-18 I mean the isotope of oxygen with a mass of 18 atomic units. The delta O-18 record is the difference between the "standard" isotopic composition of the ocean and the particular measurements, expressed as per mil (parts per thousand).

The basic idea here is that there is an isotopic fractionation that occurs as water is evaporated. Water molecules with an O-18 in them are heavier, and so are less likely to be evaporated; furthermore, if they are evaporated, they are more likely to be the first molecules to condense out of the water vapour in the tropical to subtropical areas and fall as rain. Thus the water vapour that reaches arctic areas is already very depleted in O-18, so that falling snow in arctic areas is relatively depleted in O-18.

This falling snow is what builds glaciers. Glaciers are made from water that is very depleted in O-18. When glacier volume increases, this increase in ice volume is reflected by a relative enrichment in O-18 in ocean water, as the total amount of O-18 in the world's waters is pretty much constant. The enrichment of ocean water is reflected in the oxygen isotopic content of single-celled, carbonate-shelled organisms (which are recovered in abundance in subsea cores). When these fossils are sampled by coring, the downcore variations in isotopic composition of the shells is interpreted to provide a proxy record of global ice volume.


Variations in deep ocean O-18 over the past one million years from ODP 677 (Shackleton et al., 1990). Original data available here.


At first glance, the most recent part of the ice volume record is dominated by asymmetric saw-tooth shaped cycles--marked by long periods of glacial advance and short periods of rapid glacial retreat.

In an earlier post, we saw how to construct phase space portraits in two dimensions from a time series.

The two-dimensional reconstructed phase space of this data set reveals that there are at least three "regions" of stability in phase space, each representing relatively stable volumes of ice.


Two-dimensional phase space portrait of the ice volume proxy record from 210 thousand years ago until about 8,000 years ago, showing regions of stability (marked G). The upper right of the chart represents greater ice volumes (glaciations) and the lower left represents lower ice volumes (interglacials).


This chart shows us a specific trajectory through phase space of the ice volume system over the past 210 thousand years. The line is marked at ten thousand year intervals with a dot.

At the beginning of the plot (the point labelled 210) ice volume is low. We follow the dashed curve up and to the right, and we may note that there is a lot more space between 200 and 190 than there is between 210 and 200. This implies that ice volume changed (in this case, increasing) a lot more between 200 thousand and 190 thousand years ago (or yBP) than it did between 210 thousand and 200 thousand yBP.

In the upper right of the graph, we seem numerous points plotted fairly close together. The rate of change of global ice volume was pretty slow from about 180-140 thousand yBP. This was during the next-to-last glacial maximum. There was a rapid deglaciation from 140-120 thousand yBP, followed by a long (120-70 thousand yBP) interglacial period.

During the following glaciation, we see fairly rapid growth to the loop from 60-30 thousand yBP, then more growth, leading to the most recent deglaciation.

The same curve can be followed over the past million years (but it gets a bit difficult to follow with all the line crossings). We would note certain consistencies. Firstly, the curve shows the same alternations between regions of slow movement of the curve (lots of points grouped together) and regions in which the system evolves very quickly.

Secondly, in cycle after cycle, we would note the areas of slow motion (labelled 'G' in the figure above) occur in the same regions of phase space---meaning that there are particular ice volumes (or glacial configurations) that are more stable than others. Such a system is described as having numerous metastable modes of operation.


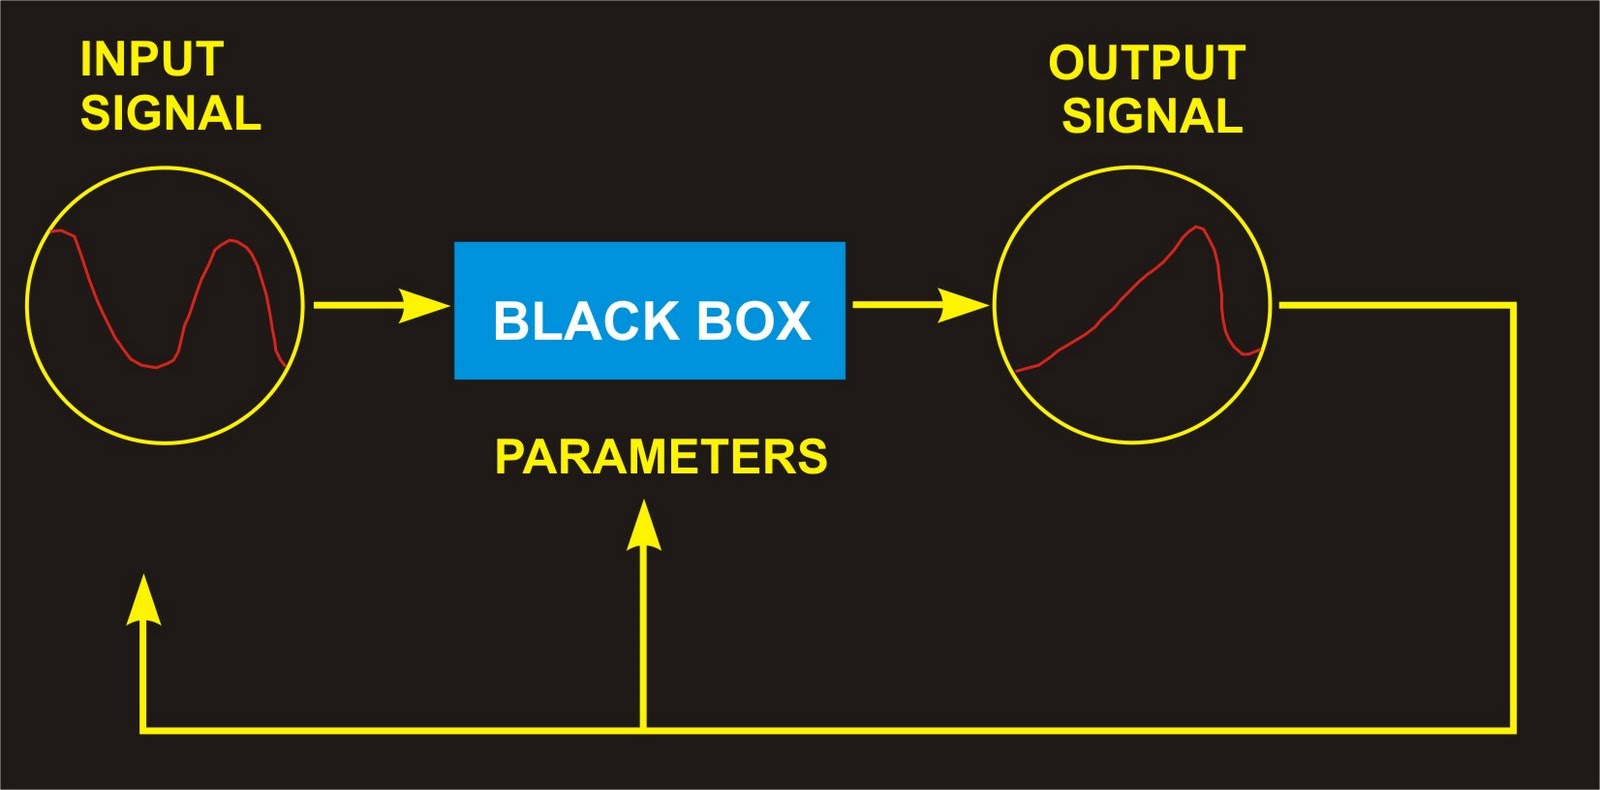
 Model of a system with feedbacks. Some portion of the output signal may react on the input, or may alter the parameters of the model.


The reasons systems behave this way is because of the presence of feedbacks. For our purposes, there are two types of feedbacks--positive and negative. Negative feedbacks tend to counter the input to the system, or rather tend to lead the system to resist changing in response to any external driving mechanism. Positive feedbacks cause the system to enhance the effects of a driving mechanism, creating the appearance that the system is careening out of control.


Schematic diagram showing the elements of a dynamic system with multiple metastable modes of operation (viz. Kauffman, 1993). Depending on the starting postion, the system will tend to evolve to a fixed solution (either a point or a limit cycle) within a region of phase space defined by a separatrix.


While the system is evolving towards one of the regions of stability (attractors in the above figure), postive feedbacks dominate, and the system evolves rapidly. While the system is within one of the regions of stability, the negative feedbacks dominate.

The climate system is subject to forcing (changes in heat received from the sun due to variations in orbital geometry, among other things) which attempt to drive the system away from the centre of attraction. As long as the system remains close to the attractor, negative feedbacks will tend to force the system back to its local equilibrium. (Arguably that is the situation we are in now with atmospheric carbon dioxide).

If the system is driven across a separatrix, it will evolve rapidly towards a new centre of attraction, and positive feedbacks will again dominate. For many systems we do not know where the next area of attraction is or what it will be like. (In our current situation, even though the Earth is resisting changes due to increases in carbon dioxide, however its capacity for continuing to do so is finite, and we 1) do not know when we will cross the separatrix nor 2) do we know what the effect of crossing the separatrix will be.)

In part 2 we will expand on this idea of attractors and separatrices and see how the concept applies to stock prices.

Reference:

Kauffman, S., 1993. The Origins of Order: Self-Organization and Selection in Evolution.

Shackleton, N.J., A. Berger, and W. R. Peltier, 1990. An alternative astronomical calibration of the lower Pleistocene timescale based on ODP Site 677. Transactions of the Royal Society of Edinburgh: Earth Sciences 81: 251.


*Well, perhaps it's the other way around.

Thursday, August 5, 2010

A partial history of hard money in Ghana

When you travel through Ghana, one feature that leaps out at you is the pile of concrete (actually sandcrete) blocks piled up on people's property. It is not unusual to see them in a place where construction is obviously ongoing, but what seems strange is seeing such piles of blocks in front of  houses in which the signs of new work are absent. Or as you whip along the highway you encounter plots of vacant land dotted with a couple of small piles totalling perhaps twoscore blocks. What's going on?


Block plant at Weija, just west of Accra. Block plants are everywhere in Ghana.


Here's the thing. About 40 years ago the Ghanaian unit of currency, the cedi, was equal in value to the US dollar. So if your uncle had been a millionaire in those days, and hid his money in the basement and then forgot about it, what would it be worth now? Brace yourselves--that million cedis you just exhumed from his basement was converted in July of 2007 into new cedis (called formally the "Ghana cedi") at a rate of 10,000:1. So if you went to the bank with one million old cedis, you would receive 100 Ghana cedis, which would be worth about USD 70. That is some loss of purchasing power, even if you ignore what has happened to the US dollar over the same timeframe.

If your uncle had been smart enough to buy gold, he would have been well ahead of the game, but even though Ghana is one of the top gold producers in the world, it was facing hard times in 1970 and there wouldn't have been a lot of gold around. Probably the best he could have done would have been to have stored his wealth in pessawa coins (1/100 of a cedi, and made of copper in those days). One hundred million such coins, although bulky, would have done a much better job of preserving his wealth than paper.

Given their monetary history, Ghanaians seem to well understand the futility of storing wealth as paper. The gradual decline of purchasing power of the new cedi (which was worth more than 1 USD in July of 2007 but is now more than 30% less) provides constant reinforcement of that basic lesson.

So how do you preserve your wealth in a persistently inflationary environment. You invest in hard assets. While for most of us that means gold, in Ghana it now means sandcrete block. They don't rot. They tend not to go away. They tend to hold their value (their price rises roughly at the same rate as the value of the cedi sinks). They are useful--most of their buyers actually intend to build something, but lack the capital to build it all at once. As there are no other useful ways to save, they hold their savings in the form of block. If they accumulate enough block they can build a better house.

The use of block as a hard asset is a relatively recent economic innovation, and has been responsible for a rapid profusion of block plants over the past ten years. This in turn has led to something of a boom in residential and small commercial construction. But different assets have been used in the past.

Gold and cowries

Ghana is the former Gold Coast. And the history of gold in Ghana is a complex one.

Gold ornaments and jewellry from West Africa have long been known to the outside world. For centuries, worked gold was sent north across the Sahara, to North Africa and Egypt (Garrard, 1989). The gold was supplied from a series of West African kingdoms, including Mali, the Songhai, and ancient Ghana (Bovill, 1995). As far as modern Ghana is concerned, the most important gold trade involved the Asante, a kingdom which arose and came to prominence due to improved agricultural practice (Wilks, 1993), but which is best known for the quality of its goldsmiths (Ayensu, 1997). The Ashanti carried out trade for gold with both Moors and Europeans, but most quantitative estimates of gold traded come from the European trade.

European exploration of West Africa was driven by a number of factors, including population pressure and the desire for new wealth. It was facilitated by the improvement in navigational aids (compass, astrolabe, quadrant), in ship design (mating of square-rigged sails and rudder from North Sea vessels with Mediterranean carvel hulls), in chart designs (Mercator), chart construction, and printing.  But the major impetus was the establishment of a navigational centre in Portugal by Prince Henry, which lasted from 1418 until his death in 1460 (Guill, 1980). The Portuguese took slaves at Arguin, an island in a bay (which may have been Cerne) that they fortified in 1448 to serve as a trading centre.  Alvise da Cadamosto discovered the Cape Verde Islands in 1457, and reached what is now Guinea-Bissau. By 1462, Portuguese ships had reached what is now Sierra Leone.

By this time, Cadamosto had determined that the gold coinage of southern Europe dating from the 14th and 15th centuries had its origin in West Africa.  He determined that it had come from the Gold Coast and the upper parts of the Niger, Senegal, and Gambia rivers, from which it passed through Melli and Timbuctoo, then overland to Tunis, Algeria, and Morocco (Junner, 1973).

From the Moors of northern Morocco, the Portuguese learned of the gold in the Gold Coast, and in 1471, led by Moors captured in Senegal, two Portuguese ships under the command of Juan de Santerem and Pedro de Escobar reached the Gold Coast, where they immediately began trading in gold dust. The trade was set up at a place called by the Portuguese “Oro de la Mina”, and this was initially held to be Elmina, although Kesse (1985) contends that it was Shama, near the mouth of the Pra River.  Fernão Gomes established a trading centre at what is now Elmina, and its importance was so great that a large fort was built (São Jorge da Mina) in 1481.  In 1482, Diego Cam reached the Congo River.  The map of Martin Behaim (1492) clearly depicts São Jorge da Mina to the east of Cape Three Points, as well as the Pra and Ankobra Rivers (Emery and Uchupi, 1984).


Old map of the Gold Coast (present-day Ghana). Compiled by Boulton (1787).


The first trade in gold dust from the mouth of the Pra River by the Portuguese is the first well-documented record of gold being obtained from the Gold Coast (Junner, 1973), although there is abundant evidence of earlier trade.  When the Portuguese arrived in the Gold Coast, the natives were predominantly hunters and fishermen.

The chief wore a great deal of gold, but gold was not used as money. Trade was conducted by the use of goods and cowrie shells.  Cowrie shells were directly convertible into gold, at the rate of 32,000 cowries to one ounce of gold (Anin, 1994).  Forty cowry shells would be tied into one string, five strings made one bunch, and ten bunches were equivalent to one Ackie of gold.  The Ashanti had a very involved system of gold weights and standards, whereby there were 16 Ackies in one ounce of gold and, 12 takus in one Ackie (Niangoran-Bouah, 1977). In the interior, gold was used as currency, according to Leo Africanus (1526), but shells imported from Persia were used for small matters.

So we see that one day, some strange-looking people showed up and began to offer fantastic items like umbrellas and steel pots and firearms and alcohol for this worthless stuff that any fool could find in any amount desired in just about any river. The sudden appearance of all this alien technology had a profound impact on the peoples on the Gold Coast, mainly causing them to re-evaluate their perception of the value of gold.

This is trade at its best. Two groups meet, each holding something that has little value to them, yet they are able to trade it for something of tremendous value. If only the interaction between Africa and Europe had remained limited to this trade.

Until the 16th century, the natives possessed considerable quantities of gold, which they had undoubtedly accumulated over a long period of time. They placed very little value on it, using it for ornamentation, and to sprinkle on the bodies of the dead (Anin, 1994). Gold was buried with the dead, because it was thought that they would reappear in a world where it would be of great value. It was freely traded for things of little value to Europeans. The natives were well accustomed to winning gold from stream and beach gravels, and they did not begin attempting to mine auriferous reefs until the early 18th century.

 Woodcut from Dapper (1668) showing native gold mining in the lower Ankobra River (presently in the western region of Ghana). This image was taken from Garrard (1989). If you visit the lower Ankobra you will notice that this image is reversed--it is unclear whether this is due to the image being the reverse of the woodcut, or whether the print was somehow reversed before appearing in Garrard (1989).


 Olfert Dapper (1668) described how the natives of the lower Ankobra River would dive into the river, returning to the surface with nuggets from the river gravels. John Bardot (1732) furthered this description, adding that the natives would return to the bank, with the bowl again on their heads, now filled with a mixture of materials from the riverbed, which were poured into bowls held by other men and women. These bowls were held against the flow of the river until the soils and sands are washed away, the gold sinking by its own weight to the bottom.  The gold has been described as being composed of small grains, but some in lumps as big as peas or beans, and as fine dust.

According to Bosman (1698), women and boys living near Elmina collected and washed beach gravels and sand after violent rain, using large troughs or trays, which they filled with sands and washed out the lighter material with water (between Elmina and Apollonia). The concentrate was washed again in a small tray until the gold could be removed. The process is much the same today.


Galamsay (artisanal) miners in action north of Asanta (just west of the Ankobra River) in early 1997. This property is now part of Adamus Resources Limited's Nzema Gold Project.


Descriptions of native women recovering gold near Cape Coast in the early 19th century suggest that they repeatedly washed the sands in a circular fashion in large wooden bowls, and visually inspect for gold at the bottom. Any gold found was dried in the sun or by fire. In the area around Taccorary (Takoradi), the natives had many rich mines where they dug ore and ground it between rubbing stones to separate the gold from the quartz.

Knowledge of gold production from the Gold Coast is sketchy.  Annual production fluctuated considerably, especially during slave wars, but estimates of production up to 1930 exceed 22 million ounces (Junner, 1973).  Production in the late 1860’s was probably less than half what it was in the early 1800’s.  Production fluctuated between about 10,000 and 20,000 ounces per year until 1903, when production climbed sharply to 200,000 ounces per year (by 1906) as European-operated mines came into production.
Artisanal mining (galamsay) activity is still very common in southwestern Ghana. Old galamsay workings are evident at numerous places along the coast. 

Money of stone

There have been other forms of money used in the Gold Coast as well. Junner (1973) refers to an early encounter with natives in what is now western Ghana who used "ceremonial axes" as money. When I first read this description, now over fifteen years ago, my first thought was "how did they know they were ceremonial?"

As you enter the Western Region of Ghana, you enter the region of Cape Three Points. This is the most prominent feature in the above map of the Gold Coast--the southernmost tip. The Ankobra River is near the western boundary of the map. A short distance west of the point--perhaps fifteen kilometres west of Cape Three Points--lies Aketekyi and Princes Town. Princes Town is the site of an old German castle (of which more will be written some other time).

I was working on the headland overlooking these two towns in early 1997 with a venerable geologist. We were walking at the edge of a cornfield on or very near the highest point of the headland--we could see the embayments on both sides of us--when my companion suddenly asked me to stop and look around. I did not notice anything out of the ordinary. He asked me what I thought about all the flakes of stone lying around on the ground. Well, okay, I could see they didn't come from the local rocks because there were none. And no boulders either. He picked up one angular piece of stone and opined that it was a hand axe. A hand axe that had broken while being flaked and so it was discarded.

I was completely skeptical. I had to admit that he had had past experience with stone age tools, having seen them during previous fieldwork in Europe. And I had to agree that the flakes of stone were definitely unusual. But I had a killer argument. The stone was talc! Talc is the softest mineral known. If you tried to cut a green sapling with a talc axe, all you would do is spoil the axe. Talc cannot cut wood--it cannot even whittle wood. You can easily scratch it with your fingernails. So we had a brief argument about it and even though I could think of no natural process that would bring flakes of talc from an unknown location to the highest point for miles, I also did not accept that any group of people would be foolish enough to make axes out of talc. For that reason, sorry, I didn't take any pictures (this was before the digital age, at least for me).

As so often happens, the revelation came later. How did the first Europeans know the natives' axes were ceremonial? I had assumed when I read those words that the axes were very small. But what if they were made of talc--a material that is too soft to be useful as a tool, but is fairly easy to work (not withstanding the occasional accidents that result in spoiling the labour).

About two years ago I decided to try to retrace my steps. My guide Kabi and I drove back to Aketekyi and quickly ascended the ridge to the headland. We were close to the stone flaking site when we were blocked by a local land-clearing project.


Fires on the Aketekyi headland, September 2008.


We were forced to retreat, and I made a fortunate discovery. I noticed the path we had retreated along looked a little bit chalky. Following the lumps of "chalk" back into the woods led me to a small defile crossed by the path, and in the exposed rock was a thin seam of talc schist. Interestingly, there were telltale signs that the little seam had been mined some time . . .


Outcropping talc schist on the Aketekyi headland. The talc is the angular pebbles in the shade of the tree.


Which begs the question--how would stone axes work as currency? I think the way they would work is that the value represented by the stone axe is the labour it took to make it. The number of axes in circulation could be increased only by applying labour, and as much of this labour would be needed for the day-to-day struggles of fishing and farming, there was probably not a great excess of labour available to make them. It is also possible that there may have been some kind of tribal restriction on the number that could be made, or some sort of guarantee like they had to be made by a particular artisan and had to be carved at a particular location, which may have had religious significance (or maybe they liked the view).

The valuation of worked stone as currency was not unique to coastal Ghana. Famously, the people of Yap used large stone disks as currency, the labour value of which was considerable as they had to travel to distant islands to obtain the stone.

One mystery may be solved, but that brings me to another. The streets of Axim (a coastal city near the Ankobra River) are covered with gravel. According to local lore, much of this gravel was dredged up from the sea, primarily by dragline, although no one seems to be able to put an exact date on when this happened. Among the stones of some parts of Axim are these.


Stones of Axim, with holes of uncertain origin.


My first thought, when finding these, was that they were fire-starter stones--the holes worn into them by the friction of the spinning wood. But it doesn't seem logical to use such small stones for such a purpose. Also, the two holes on the right side of the rock at the top of the picture above are actually one "U-shaped" hole. This would seem to be very difficult to make accidentally, and might preclude a natural origin (given the hardness of the rock).

There are organisms which can make indentations in a rock. Abalone, for instance do this, and there are rocks along the shore not far from Axim which have just such marks in them.


The indentations on the rock at left are caused by abalone, but they are all much larger than the indentations in the above pebbles. Note the linear distribution--the abalone seize on planar weaknesses in the rock, where it is easier to rasp their way in.

Furthermore, some of the indentations in the pebbles actually pass completely through the stone (below).


So far we have only found these features in dredged gravels of Axim, which does happen to be one area with a profusion of tool-sharpening marks on coastal rocks.  Assuming they are man-made and not some natural features, they do not appear to be useful items, nor do they appear to be representative of anything. They may have been some simple ornamentation.

Or maybe they were money. Once again, the value of the individual pieces could have been tied to the labour represented by their fashioning. I have no evidence that these were money, but there are a lot of them to be found in shallow marine gravels in western Ghana, once again pointing to the possibility of finding evidence of human habitation in what is now the sea.

Ghanaians have come full circle--from using worked stones (possibly) as money, to worked stone axes, to cowrie shells and gold, and back to worked stone (sandcrete block). I don't see any signs of paper money used except in the very recent past.

Additional note: The sandcrete block is a useful hedge against inflation. But it is a poor hedge against deflation, which sadly, occurs with a vengeance every five years or so. Paper money vanishes, and people with block find they can trade them for neither money nor food.

References

Anin, K., 1994. Gold in Ghana (4th ed.).  Selwyn Publishers, Ltd.  Accra, 287 pp.
Ayensu, 1997. Ashanti Gold: The African Legacy of the World's Most Precious Metal. Marshall Editions, 200 p.
Blier, S. P., 1998. The Royal Arts of Africa: The Majesty of Form. Harry N. Abrams, Inc., New York, 272 p.
Cary, M. and Warmington, 1963. The Ancient Explorers (revised edition). Penguin Books, Baltimore, 319 p.
Dapper, O., 1668. Naukeurige Beschrijvinge der Afrikaensche Gewesten. Amsterdam.
Emery, K. O. and Uchupi, E., 1984. The Geology of the Atlantic Ocean. Springer-Verlag, New York, 1050 p.
Garard, T., 1989. Gold of Africa: Jewellery and Ornaments from Ghana, Côte d’Ivoire, Mali and Senegal. Prestel-Verlag, Munich, 247 pp.
Guill, J. H., 1980. Vilo do Infante (Prince-Town), the first school of oceanography in the modern era, an essay. In M. Sears and D. Merriman, eds., Oceanography, the Past. New York, Springer-Verlag, p. 596-605.
Hamilton, H. C. and Falconer, W., 1854. The Geography of Strabo. Bohn, London, 3 v., 1351 p.
Junner, N. R., 1973.  Gold in the Gold Coast.  Ghana Geological Survey Department, Memoir 4, 67pp.
Kesse, G. O., 1985.  The mineral and rock resources of Ghana.  Balkema, Rotterdam, 610 pp.
Niangoran-Bouah, G., 1977. The Akan world of gold weights. Accra, 3 vols.

Wednesday, August 4, 2010

Please, do be so kind . . .

. . . as to look these people in the eye before you decide to kill them.

I know you believe that Iranians live in the Stone Age.

But try to get to know them. Iran is the natural ally for America in the Middle East. Much more so than that other country.

Sunday, August 1, 2010

Somali Pirates Income Fund preliminary prospectus

This is a reprint of a post I originally made in realcent. This post is not intended as investment advice. I am not an advisor. Do your own due diligence. And pay particular attention to the risk factors.


I have received this via the usual channels:

This prospectus constitutes a public offering of these securities only in those jurisdictions where they may be lawfully offered for sale and therein only by persons permitted to sell such securities. No securities commission or similar authority in Canada, the United States or elsewhere has in any way passed upon the merits of the securities offered hereunder and any representation to the contrary is an offence. This prospectus does not constitute an offer or a solicitation to any person in any jurisdiction in which such offer or solicitation is unlawful. This offer is not being made to, nor will subscriptions be accepted from or on behalf of, holders of shares or rights of Somali Pirates PLC (“SPP”) in any jurisdiction in which the making or acceptance thereof would not be in compliance with the laws of such jurisdiction. However, SPP may, in its sole discretion, take such action as it may deem necessary to extend this offer to such jurisdictions. These securities have not been and will not be registered under the United States Securities Act of 1933, as amended, and may not be offered or sold in the United States or to a US person (as defined in Regulation S issued under such Act), except in exempt transactions under that Act.

Units offering
Somali Pirates Income Fund

Minimum CAD 750,000
Maximum CAD 1,500,000

Private Offering of up to 5,000,000 units

Somali Pirate PLC (“The Company”) is offering up to 5,000,000 units for purchase at a unit price of CAD0.30. Each Unit consists of one Share and one half of a Warrant in a proposed new company (Somali Pirate Income Fund, or “SPIF”). Each full Warrant will allow the holder to purchase an additional share of SPIF at an exercise price of CAD 0.60 on or before April 1, 2012. This offer expires October 1, 2010 (the “Expiration Date”). The Offering is conditional upon a minimum subscription for 2,500,000 Units, equal to CAD $750,000 being received within 90 days from the date of the final receipt for this prospectus. In accordance with regulatory policy, related parties (officers, directors, shareholders holding more than 10% of the outstanding Common Shares and their associates and affiliates) may not through the purchase of Units increase their respective percentage shareholdings in SPIF in excess of that percentage held by them in the Company. The Subscription Price of the Units was set by the Board of Directors of the Company and determined by them to be in their opinion less than the fair value of the Common Shares as at the date of this Prospectus.

This Offering is not underwritten nor is an agent representing the Company in making this Offering. The Company, on its own behalf, will be offering the Units to the holders of Common Shares of the Company, as well as other investors who qualify under the Securities Act. Subscriptions will be received subject to rejection or allotment in whole or in part and the Company reserves the right to close the subscription books at any time without notice.

This prospectus qualifies the distribution of the Units and of all of the Common Shares issuable upon exercise of the Warrants. The Offering is subject to the approval of certain legal matters by Poynt & Chute, Barristers and Solicitors, Toronto, Ontario, on behalf of the Company.

It is expected that definitive certificates evidencing the Common Shares issued pursuant to exercise of the Units will be available for delivery forthwith after the closing of this Offering. All funds received shall be held in trust by a Subscription Agent, the identity of whom is undisclosed in order to prevent asset seizure or destruction, until the minimum amount of the offering has been received.

Upon receipt of the minimum amount by the Subscription Agent, all funds shall be released to the Company. If the minimum is not received within 90 days from the date of the final receipt for this prospectus, all proceeds shall be returned to the subscribers without deduction or interest.

The Company

Somali Pirate PLC (“The Company”) was incorporated on October 21, 2009. Prior to this time, the Company operated as a community collective. Its business ventures had resulted in over $1 million (US) in revenues at the time of incorporation. After incorporation and local fund raising, further business activities resulted in revenues of a further $2.5 million (US), one half of which was disbursed to investors as set out in the original agreement. An analysis of the business operating regime suggested that the ability to raise larger amounts of capital could result in an expansion of the geographical range of the Company’s business model, with concomitant increases in business revenue.

Somalia is a country which is currently engaged in civil war. The current government regime is highly favourable to the business of the Company.

Business of the Company

The Company’s area of operations are in the Gulf of Aden, off the coast of Somalia. The Company has acquired exclusive licence to exploit block 2-G, which covers an area of 5,000 square kilometres across several shipping routes. The Company is in the business of capturing foreign vessels and ransoming the personnel, vessels, and cargo.

Use of Proceeds

The Company intends to use the proceeds of this financing to acquire assets required to carry out its business, to fund its ongoing business operations, and to carry out the legal filings required to acquire a public listing.

Risk Factors

In addition to normal business risks, the purchase of Units of the Company may be considered speculative for the following reasons:

1. There is presently no market through which the Common Shares or Warrants of the Company may be sold.
2. Although the Company has paid dividends in the past, there is no guarantee that the Company will be able to pay dividends in the future.
3. In order to carry out its operations, the Company needs to acquire certain materials which are affected by the current arms blockade of Somalia. There is no guarantee that the Company will be able to acquire these materials, and this may negatively impact the business of the Company.
4. The Company operates in a marketplace where significant competition exists. The Company competes with larger companies which have greater assets and financial and human resources than the Company, and which may be able to sustain larger losses than the Company to develop business. There is no assurance of the Company’s ability to contend successfully with such forces.
5. Shareholders of the Company should be aware that they will be relying on the good faith, expertise, and judgment of the Company, as well as its officers and directors, to make appropriate decisions with respect to investments and operations.


The officers and directors of the Company.


6. The Company is dependent on maintaining its key staff to develop its operations in Somalia. The Company does not have any long-term employment agreements nor any key-man insurance on any such key staff. Loss of key staff would likely have a significant adverse impact on the advancement of the Company’s business.
7. Investing in companies in a development stage is highly speculative and involves substantial risks, which even a combination of experience, knowledge and careful evaluation may not be able to avoid. There is no assurance that commercially viable targets will be discovered within the Company’s field of operations. The long-term prospects of the Company will be in part directly related to the cost and success of the exploration programs which may be affected by numerous factors. While the rewards can be substantial, numerous companies are unsuccessful and their shares may become worthless.
8. The Company may require additional equity funds to finance either ongoing or expanded operations. There is no assurance that such additional equity capital will be available to the Company when required or, if available, will be available on reasonable or satisfactory terms. In such circumstances, the Company’s interests in its properties could be substantially diluted or even lost.
9. The Company is affected by numerous factors beyond its control. These factors include the cost of labour, materials and services, cost of financing, technological change, and government regulation, including regulations relating to prices, taxes, royalties and environmental protection, the exact effect of which cannot be accurately predicted. Such factors may not be able to be overcome even by a combination of experience, knowledge, and careful evaluation.
10. Environmental legislation in Somalia is evolving in a manner which increasingly involves strict standards of enforcement, increased fines and penalties for non-compliance, more stringent environmental assessments of proposed projects and a heightened degree of responsibility for companies and their employees, officers and directors. Such legislation often involves control of hazardous materials, emission controls, and remediation obligations. The Company's policy is to monitor environmental legislative and regulatory requirements and to ensure that its exploration and other activities meet or exceed such requirements. The Company is not aware of any non-compliance to date. However, there is no assurance that changes in or regulatory requirements will not result in non-compliance in respect of existing and ongoing activities or that notwithstanding the Company's efforts events or incidents of non-compliance will occur. The effects of such risks cannot be predicted at this time.
11. The Gulf of Aden has recently come under the self-appointed jurisdiction of several extranational organizations. These organizations include, but are not restricted to, the United States Navy, the European Union Navy, the British Navy, the Indian Navy, the Chinese Navy, and the Turkish Navy. The operations of these organizations may lead to losses of the Company’s material and personnel, which may have a significant adverse impact on the advancement of the Company’s business.
12. The principal operations of the Company are anticipated to be in Somalia, a foreign country. Accordingly, the operations of the business in Somalia will be subject to risks associated with a company carrying on business in Somalia. These include risks of changes in environmental legislation or policies; expropriation; changes in foreign investment policies; and political risks. The laws of Somalia are different than the laws of Canada and the differences may be material. Moreover, the legal and court system in Somalia may not provide the same types of remedies which are available in Canada. A change in government or a change in policy by the government may significantly adversely affect the Company’s business or property rights. In addition, foreign properties, operations and investments may be adversely affected by local, political and economic developments, including nationalization, laws affecting foreign ownership, government participation, royalties, duties, rates of exchange, exchange controls, currency fluctuations, taxation and new laws or policies as well as laws and policies of Canada affecting foreign trade, investment and taxation.
13. In the event that the Company enjoys significant successes, operations of the Company will be affected by the fluctuations in the value of the United States dollar and the Somali shilin. Currently, most revenues of the Company are denominated in United States currency. However, most of the Company’s operating costs are currently in Somali shilin. Furthermore, in the event that SPIF begins paying dividends, these will be paid to Canadian investors in Canadian dollars. Accordingly, in addition to fluctuations in the price of cargos and the value of hostages, the Company could also be affected by changes in the relative values of Somali shilin, the Canadian dollar, and the United States dollar. The Company does not currently hedge against foreign currency fluctuations and has no present intention of entering into any such hedging activities.

Legal Matters
The Company is not party to any legal proceedings nor, to the knowledge of management, are any proceedings currently contemplated. Certain legal matters relating to the offering will be passed upon by Poynt & Chute, Toronto, Canada. As at December 21, 2009, the partners and associates of Poynt & Chute beneficially own, directly or indirectly, no Common Shares of the Company.

Information flow in price selection, part 2: stock charting and insider trading

In our last installment, we looked at creating higher dimensional phase space diagrams from a single time series. This technique is useful for inferring the dynamics of complex systems from individual time series. In the phase space, the system at each instant of time is represented by a single point in a 2- or higher-dimensional graph. A sequence of points describes the evolution of the system through time. Traditionally we draw a smooth curve through the sequential points, which is described as the trajectory of the system.

Today I would like to look at reconstructing the phase space of some idealized stock chart patterns.

Let's look at a simple one: the symmetrical triangle. I have digitized an hypothetical stock price series in excel and plotted the series. I made the limbs of the formation approximately linear, but rounded the edges, as the reconstructed phase space plot will look better if the limbs aren't perfectly linear.


Wedge pattern in a hypothetical stock. Breakout is circled.


The figure above represents a wedge--though not a falling one. Like all time series, the data are one-dimensional. We can use excel to create a 2-dimensional phase space portrait by lagging the price data by a time that is roughly half the time taken to move from a short-term low to a short-term high (this may seem vague but it is because I have not presented a time scale on the above graph).


Two-dimensional phase space portrait of the above stock price. The two dimensions are the price, and the lagged price. The flow of the system is in the direction of the arrow. As time advances, the system follows the trajectory around first the outer loop, then the smaller inner loop, and after the breakout, towards the upper right corner of the graph.


In the first part of this essay, we looked at a simple chaotic function to see the relationship between the one-dimensional and two dimensional projections. The Lorenz equations give us a function that exhibits simple chaotic behaviour, which is believed to be characteristic of many natural systems. We saw that complicated looking butterfly function. Now let's look at a smaller portion of it--say 501 points (the ones I have selected are points 100-600) from the excel file generated last time.


Lorenz calculations showing x-values only from point 100 (at left) to 600. Looks a little familiar. . .


The above does look rather suspiciously like the wedge pattern in the stock price shown above. Except for one thing--time is flowing from left to right. So the wedge is actually running backwards when compared to the stock price pattern.


The 2-D reconstructed phase space portrait from the above graph, using a lag of 12 points. The abscissa is price (higher to the right), and the ordinate is lagged price (higher towards the top). At first glance, this looks a little familiar. We see what appears to be the same flow starting from the larger loop, spiralling inwards until Pow! Moonshot!


We wish all investing was this easy. But there is something wrong. Unfortunately, this trajectory starts at the upper right and moves to the region of low prices at the bottom left. Not such a good investment after all!

The characteristic feature of stock price charts is the apparent time reversal--the dynamics of stock prices flows through time backwards in comparison to those of natural systems. The dynamics of the natural system is driven by the flow of energy, with consequences following from causes. We see a rapid evolution towards a new area of phase space, and subsequent fluctuations represent instabilities which grow until the system rapidly shoots over to a new region of phase space.

So how do we explain the reversal in time observed in the stock chart patterns?

As my background is science, you will forgive me if I insist that the natural systems are going the "right" way through time and the economic systems are moving backwards.

Stock prices we normally consider to be driven by greed and fear. But what does this really mean? They are driven by flows of money, which represents information in the economic system (it is not the only information in the system). That the dynamics of the stock prices evolve through time in the opposite direction relative to natural systems suggests that players with foreknowledge of some forthcoming announcement (what we call "insider" information) are making good use of their information.

In the absence of potential profit, that "insider" information would not flow out into the market, but rather the market would learn the information at the time that some announcement is made by the company in question. The profit margin actually causes the information to flow out into the market more rapidly than it would flow otherwise. Furthermore, the very existence of such an opportunity argues against the efficient-market hypothesis.

In conclusion, it appears that stock charting gives us some limited forecasting ability in stock prices because trading on insider information is endemic in the markets.