
No, this is not about Egypt.
I use the term "stability" a lot, as in area of stability. Sometimes I describe the stability of systems projected into phase space as "Lyapunov-" in nature. It may have been awhile since I discussed the criteria for determining whether we observe stability in a system--the Case-Shiller index, for instance.


I've just noticed that I didn't label the axes on the lower figure--but they are the same as in the upper figure.
Why are the yellow blobs, and the large cluster of points at the lower left of the second figure, areas of stability, whereas the small cluster near the top of the lower figure is not?
One clue is whether we see many points that occur close together in time also close in phase space. A lot of points clustered in one area means that whatever measurement we are looking at is not changing much over a long period of time--just what we mean by stability, no?
Areas of stability can only occur in certain places on a time-delay phase space reconstruction.

Same figure as above, but with the "y = x" line plotted. Points along this line would represent points where the value of the Case-Shiller index is the same as it was four years earlier. Areas of stability will straddle the line. The system cannot remain in one spot for long if it is off this line. That doesn't mean that the system has to report to the line. It can meander away from the line for long periods of time (twelve years already)--but while it is doing so, it is not stable.
What about the point where the state crosses the y = x line at the first quarter of 2008?

The first quarter of 2008 would be about where the arrow was. The index was at the same level in early 2004--but we would not say that that was a point of stability because of what the index did during that interval.
Time-derivative phase space reconstructions are topologically equivalent--but perhaps more intuitive, as in this case the system dynamics are reconstructed by plotting a measurement against its rate of change.

In this different projection--time-derivative state space portraits (of the gold-silver ratio)--in which I have plotted the GSR vs its first time derivative, all points of stability must lie along the dr/dt = 0 line. But why doesn't every point on this line represent stability (for example, the point where the curve crosses 0 when GSR = 96)?
You may recall from calculus that apart from critical points of inflection, rates of change also reach zero at local maximum and minimum points. So once again, the fact that a point plots on an area that may represent stability does not mean the system is stable at that point. You need to see a lot of other points, which are close neighbours in time, in the same area.
I use the term "stability" a lot, as in area of stability. Sometimes I describe the stability of systems projected into phase space as "Lyapunov-" in nature. It may have been awhile since I discussed the criteria for determining whether we observe stability in a system--the Case-Shiller index, for instance.


I've just noticed that I didn't label the axes on the lower figure--but they are the same as in the upper figure.
Why are the yellow blobs, and the large cluster of points at the lower left of the second figure, areas of stability, whereas the small cluster near the top of the lower figure is not?
One clue is whether we see many points that occur close together in time also close in phase space. A lot of points clustered in one area means that whatever measurement we are looking at is not changing much over a long period of time--just what we mean by stability, no?
Areas of stability can only occur in certain places on a time-delay phase space reconstruction.

Same figure as above, but with the "y = x" line plotted. Points along this line would represent points where the value of the Case-Shiller index is the same as it was four years earlier. Areas of stability will straddle the line. The system cannot remain in one spot for long if it is off this line. That doesn't mean that the system has to report to the line. It can meander away from the line for long periods of time (twelve years already)--but while it is doing so, it is not stable.
What about the point where the state crosses the y = x line at the first quarter of 2008?
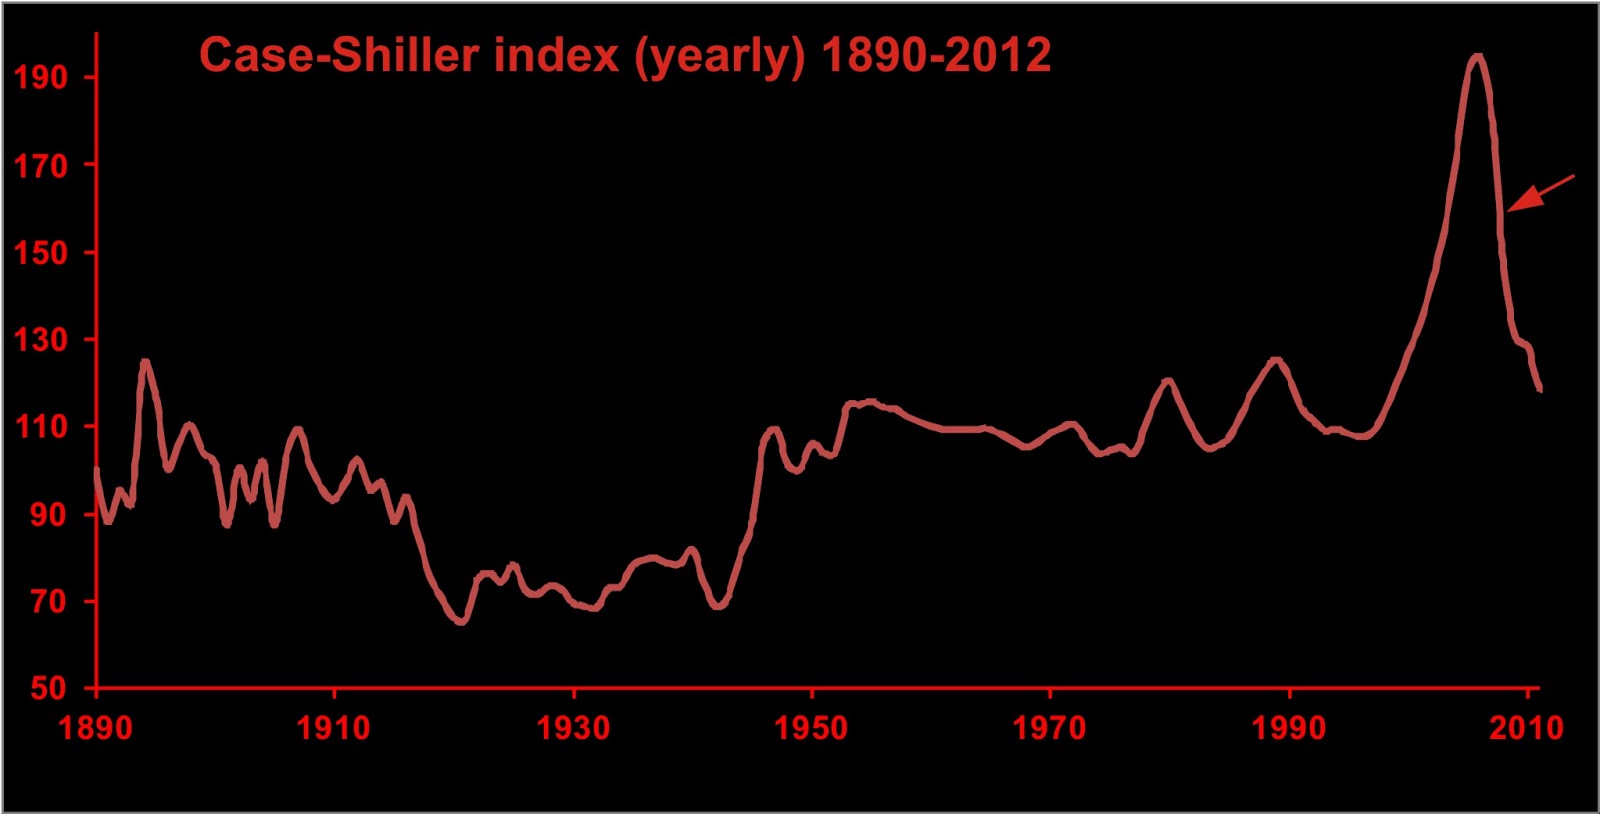
The first quarter of 2008 would be about where the arrow was. The index was at the same level in early 2004--but we would not say that that was a point of stability because of what the index did during that interval.
Time-derivative phase space reconstructions are topologically equivalent--but perhaps more intuitive, as in this case the system dynamics are reconstructed by plotting a measurement against its rate of change.

In this different projection--time-derivative state space portraits (of the gold-silver ratio)--in which I have plotted the GSR vs its first time derivative, all points of stability must lie along the dr/dt = 0 line. But why doesn't every point on this line represent stability (for example, the point where the curve crosses 0 when GSR = 96)?
You may recall from calculus that apart from critical points of inflection, rates of change also reach zero at local maximum and minimum points. So once again, the fact that a point plots on an area that may represent stability does not mean the system is stable at that point. You need to see a lot of other points, which are close neighbours in time, in the same area.
No comments:
Post a Comment