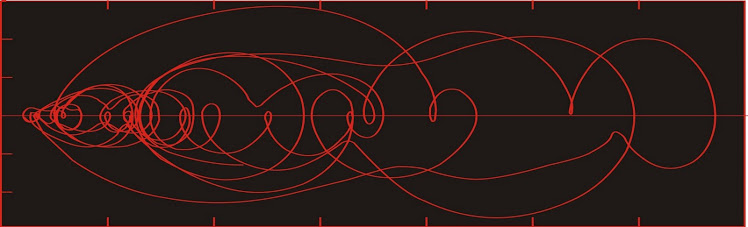
Dust flux, Vostok ice core

Dust flux, Vostok ice core
Two dimensional phase space reconstruction of dust flux from the Vostok core over the period 186-4 ka using the time derivative method. Dust flux on the x-axis, rate of change is on the y-axis. From Gipp (2001).

Thursday, February 21, 2013

IMF position on global housing prices--no impact from monetary policy

A recent IMF working paper entitled Global House Price Fluctuations: Synchronization and Determinants (pdf) attempts to look for the reasons behind global linkages in house prices.

Of interest is their conclusions (handily in the summary)--"Global interest rate shocks tend to have a significant negative effect on global house prices whereas global monetary policy shocks per se do not . . ."

And yet these graphs comparing growth rates (annual?) appear on page 39 (not next to each other)


The two curves are practically identical. So it would seem that change in house prices is strongly controlled by changes in available credit. 

Isn't this tied to monetary policy?

Saturday, February 16, 2013

Some short stories about Finland

I arrived in Helsinki late at night, about five hours before my train was supposed to leave from the station. I tried to sleep in the station, but security threw me out, giving me only time to put my luggage in a locker and hit the streets.

Late night/early morning in Helsinki is more lively than back home. For starters, the bars stay open until four. So for the first hour of wandering the streets, I greeted the occasional drunk as he staggered home/urinated in the street/collapsed in a bus shelter. I decided to look for somewhere quiet to take a nap.

It was about two in the morning when I saw her--a young woman dressed up as a pumpkin. There was nobody else around. She saw me and started walking towards me. "Good evening, sir," she said, in impeccable English. "Would you like a glass of orange juice?"

I decided that this event, unusual though it seemed to me, was probably an everyday event in Finland. So I agreed. Besides she was gorgeous.

"One moment, sir," she said. "I have to squeeze it from my body." She began to crush her pumpkin costume (which I now realized was a giant orange costume). Then she drew out a carton of orange juice and a plastic cup, poured, and gave it to me. And then wandered away, looking for other unsuspecting drunkards.

- - - - - - - - - - - - - - -

About two years later, I was working on a diamond exploration project in Finland. The company had hired a few local geology students as assistants, and it so happened that one day one of them asked me if there was anything I wanted to know about Finnish culture. So naturally I asked them about the pumpkin-woman. All I got were blank looks.

They had a short huddle. I could hear them whispering. "He made that up." "No, it's too strange." Eventually they came back but had no explanation.

- - - - - - - - -

So every day we were out sampling on different farms in Finland. The days were all the same--we would drive out to a farm, one of the Finns would go to the door, usually walk in without knocking, and they would chat for a bit and get permission for us to do collect our samples. Occasionally we would have a whole group of farmers together and get permission over a wide swath of land.

One day I decided I had practiced Finnish enough that I wanted to address the farmers. I practiced a little speech I wrote about kimberlites and glacial mineral trains--the Finns pronounced it good enough, so the next day a gave a little talk about diamond exploration. After we had collected the samples and got back into the van, one of the Finns said to me, "that was really good. Really very good. Only--you used the word for 'ice cream' (jaatelo) when you meant 'glacier' (jaatikko)." "When?" "Every time, actually. But don't worry. Everyone knew what you meant."

Unfortunately just before we had arrived at the farm, I saw a sign advertising (jaatelo). I didn't know the word, so I asked if it meant crushed ice. When I had found out it was ice cream, I decided to remember it--jaatelo, jaatelo. That's my excuse. There was nothing for it but to go to the ice cream shop and order a glacier.

- - - - - - - - - -

We were in some northern town in Finland (Kajanni, perhaps, but I don't quite remember). It was a small town and we had all gone for a drink in some pub where there was a blackjack table and this enormous bouncer who must have been eight feet tall and just about as wide. It turns out that he was a shotputter on the Finnish national team when he wasn't bouncing, and it looked as though his schtick was if you caused any trouble he would rip your head off and hurl it down the street. New world record!!!

The boys were playing blackjack. I had to go back to the motel for something (probably money) but before I got there I met this couple who were out walking their dog. They asked me where I was from, and when they heard Canada they just about fell over--the man kept saying how much he loved Canada--one thing led to another and they invited me back to their apartment for a drink.

Their apartment was dark and incredibly filthy. Every dish in the place was dirty and piled up in the kitchen. The man inspected a couple of glasses, choosing one that seemed to have less caked on it then the others, and filled it with a strong-smelling colourless liquid with chunks of raw potato swimming around in it. Drinking followed.

I had this idea that if this drink could be marketed by Dave Nichols, he could call it "Memories of the Gulag."

It turned out the man was a film-maker--he made these short little documentaries like the ones they used to show on CBC years ago in between shows-National Film Board vignettes. That sort of thing. He had a wall full of source materia--such as parachute jumping, skateboarding, drinking. He showed me a short film he made about a friend of his who had recently died. He wanted my help. He was making a short film about the Doors, and he wanted a brief scene narrated by a native English speaker.

There was more drinking. More short films. I got to dance with the dog. They filmed that too. There was more drinking, then some falling down, and as they went to sleep under the table I got up and staggered back to the hotel. There was only a little more falling down.

So the next day the Finns asked me where I went. So I told the above story, and they went off into one of their little huddles again. "He just made that up." "No, it's too strange." Then they announced that I was not to go wandering off by myself any more. What? Why not. One of the girls: "Because we live here in Finland and we never see these things!"

Sunday, February 10, 2013

Supercomputation in the social sciences

At long last, the partnership between the NSA intensive computation group and the Institute for Complexity theory has come to fruition, and the result is a new computer capable of studying complex strategic and geopolitical issues. This new machine has two separate formal logic methods allowing it to accept as input all forms of available information. Thus, in addition to ordinary numerical inputs (number of kills, manufacturing indices, shipping information) this computer is able to break down speeches of important political figures, analyze and project trends in social media, and even use keyword counts from global emails as a means of determining the mood on the street.

Imagine the excitement then, as President Obama asked this new computer it's first question. "How far are we from a statisfactory resolution of our problems in Afghanistan."

For several minutes, the computer whirred softly. Out came the answer: "237,000 miles."

The President and his advisors all considered this answer carefully. But nobody understood what it meant. Perhaps the computer misunderstood the question. So they tried again.

"How  far are we from achieving victory in the war on terror?"

Once again the computer went to work, and the answer: "One million miles."

One of the programmers interjected. "Perhaps we should have the computer show us the information used in its calculation." And so it was done.
Today we are one step closer to the establishment of the US-Afghan strategic partnership. Most importantly, today we are one step closer to our shared goal and vision of a secure and sovereign Afghanistan
                           - General John Allen, April 8, 2012 
The improvement we have witnessed recently in Iraq represents marked progress in the Global War Terror and brings us one step closer to eradicating terrorism establishing another democratic ally in the region
                          - Senator John Boozman

The following timeline highlights ten drone attacks which resulted in deaths of al Qaeda operatives or other militants. These deaths take us one step closer to victory in the war against terror. [series of drone strikes follows]
                       - an Express Tribune blog posting 
While our fight against terror is far from over, I am hopeful that bin Laden's death will bring us one step closer to peace
                        - Congressman Mike Thompson 

Wednesday, February 6, 2013

Why junior miners suck, part 2

An epiphany of sorts the other day while dreaming in a jet-lagged state.

I remember a colleague showing me an article back when I first got involved in the sector. It was an interview with Peter Munk IIRC and discussed the valuation of projects from the exploration stage through to production. The graph looked something like this.


The first part--the discovery--is marked by volatile and big swings in price. Once the decision was made to take it to production, there was a drop in value--maybe as the various difficulties of production were sorted out. Eventually money is spent, and the mine is built, and it again increases in value into production  (assuming no major problems arise).

I remember thinking that the big drop in value between the production decision and building the mine was some sort of market inefficiency.

In retrospect, I think that at the time of the article, the retail market controlled the share price of the exploreco during the exploration/discovery phase (if a bunch of kittens chasing a ball of yarn could be said to be in control of anything). What I think has happened since then (certainly since about 2008) is that the institutions are now in control throughout the life cycle of the discovery and development--and they don't like that drop in value after the production decision. It looks bad on their quarterly statements.

So now the valuation curve looks more like this:


Most of the fun and good times at the exploration stage are now gone and the value of the project increases as money is committed toward development. I have to admit that this looks like a more reasonable trajectory for the development of an ongoing business.

If this is the case, then investing in explorecos has become a high-risk, low-reward scenario. In fact, the only possibility of a reward is if the company has a plan to achieve production that doesn't involve selling hundreds of millions of shares at a nickel.

Wednesday, January 30, 2013

The new regime for precious metals

Today we look at long term charts of some key commodities and investigate means by which we might gain insight into the dynamics of their price movements. The methods are from a tool-set I have used for studying climate, much of which has been presented previously.

The key problem is interpreting the dynamics of a complex system from empirical observations. These observations are in the form of measurements of some parameter, like temperature, salinity (in ocean climate studies), or price. For our purposes we will consider month-end prices of gold, silver, copper, and rough rice (CBOT contract) from January 1996 to December 2012. The copper chart appears below.


The charts are most commonly studied as a plot of price vs time. There are many articles written on the statistical methods used. Is it a cup with handle? What about that wedge at the end there? Many newsletter authors have made (or have attempted to make) a business of selling their special methods. For a limited time only*, The World Complex offers its techniques for free. At your own risk, of course.

The dynamical evolution of a complex system is described by a succession of states through which the system has evolved. We have no way of perceiving the actual state of a complex system at any given time, but we may create a "reconstructed state" from empirical observations. Ergodic theory tells us that the succession of reconstructed states will be topologically similar to the succession of actual states, so that studying the "reconstructed state space" will enable us make inferences about the dynamics of the complex system under observation.

Reconstructed states can be most easily created from multiple time series (outputs) from the system, if present, by simply presenting a scatter-plot of the corresponding observations from the different time series. They can also be constructed from a single time series, an example of which we will see next time.

Rather than drawing a best-fit line through the states, we connect them by drawing a curve through them in sequence. This curve is described as the trajectory of the system, and can be said to represent the system's evolution through time.

The state is reconstructed in n dimensions by n observations, where n (the embedding dimension) is ideally chosen so that there are no crossings. Usually n > 3, which is a little difficult to display. Consequently, I normally use n = 2, which is less than ideal, but still useful.

Example 1: Gold/copper vs Silver/rough rice (gold and silver as $/oz, Cu in $/lb, rice in $ per hundred-weight)


This is a plot we have looked at before. The trajectory of the system is complex and fine details are difficult to describe, but overall, the system has largely been confined to the yellow ellipse left of centre, with the exception of three periods: 1) the run-up in copper and silver prices starting in 2006; 2) the commodity collapse in late 2008, when gold held up better than the other commodities in this chart; and 3) the excursion of the past 3 years, which either started in March 2010 (orange arrow on the right at the break-out of the ellipse) or in mid 2009 (left orange arrow at the beginning of the trend). Given its size and duration, we give greater significance to the latest excursion.

But what is the nature of the excursion? Did rice collapse? Or silver rise? Silver has been rising since 2002. Then came a rapid advance up until early 2011, which I'm sure we all remember.

Same commodities--different order.


Not too different (although in this one I had rice in cents per hundredweight). Most of the past seventeen years has been spent confined to the portion of state space within the ellipse, with the exception of the three times noted in the first example, and Buffet's purchase of silver in 1998. None of the excursions had lasting power except for the current one, which broke out of the ellipse in early 2010.

Again--did rice collapse? Or did gold suddenly accelerate in 2010?

Recombining the ratios one more time . . .


Here we see the famous "rabbit sitting in a stroller" formation, which means . . . well, you'll have to subscribe to find out.

The main difference between this graph and the others is that there is no recent excursion of any length.

The reason is that the excursion is the separation of the precious metals (which still includes silver) from the industrial metals and agricultural commodities.

Even though gold and silver have been in a bull market for over ten years, the real regime change only happened about three years ago. What happened?

This.


Data sourced from World Gold Council.

Central Banks were net sellers of gold until early 2009. That big spike is misleading, as it corresponds to China's announcement that it had purchased 454 tonnes over the preceding six years (note that China has not reported any gold purchases since that time). At that point the race was on for Central Banks to buy gold.

I believe it is the Central Bank purchases of gold that have created the new regime we observe in the Au/Cu vs Ag/rice state space.


* until the powers of darkness control the internet