Dust flux, Vostok ice core

Dust flux, Vostok ice core
Two dimensional phase space reconstruction of dust flux from the Vostok core over the period 186-4 ka using the time derivative method. Dust flux on the x-axis, rate of change is on the y-axis. From Gipp (2001).

Sunday, March 30, 2014

Scale invariance in the changing economics of resource extraction

Some simple discussions today that follow from our last exciting episode.


First issue - there is a limit to the size of deposits (given our current state of understanding). For gold, you can't have a hydrothermal flow system with a radius of hundreds of km--the crust is too thin. Also the crust has too many heterogeneities, which can each trap some amount of the gold in a circulating system. So at some point, the probability density for the right tail has to drop off a cliff, instead of declining steadily forever.

There are some interesting ideas about the Witwatersrand invoking means of forming gold deposits which are no longer active that could have formed deposits over scales of hundreds of km.


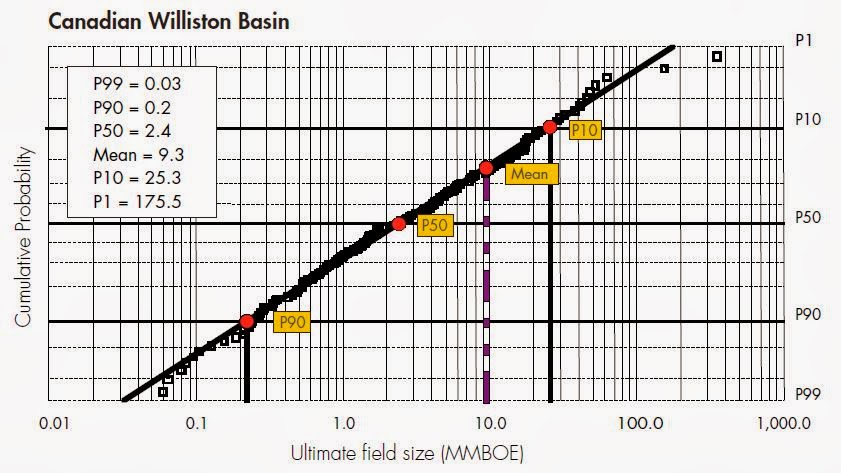
As an example, I have plotted the size distribution of reported deposits in Nevada (pdf here). It is a graph which should mimic the white hyperbola in the first figure. It might look better if we had a lot more deposits to work from. The smallest deposits on this chart were only about 2,000 ounces--and one of them had already been mined out. I would naturally expect far more accumulations of gold in that size range in Nevada--but for economic reasons, only two have had enough work done on them to define a resource.

Second point is that size isn't everything. There are quality issues to consider as well. For instance, conventional thinking suggests there is little appetite for financing mining operations on gold deposits smaller than 2 million ounces. Anecdotally, however, there is increasing interest in financing small, near-surface oxide deposits because their capex and operating costs are both low, recovery rates are high, and their long-term environmental legacy costs are likely to be low. Similarly, grade affects the economics in a more complex manner than we can capture in the above figures. What might work would be to classify the deposits by grade or type, and create the same type of plot--but that is a project for another day.

Third issue--obviously, the economics of the extraction business don't stay constant. There are technological breakthroughs, making extraction cheaper. Or the commodity price rises. These change the location of the left limb of our hyperbola, making a whole new group of deposits (generally among the smaller of them) economically attractive. But some large, hitherto uneconomic, deposits may become economic as well (I'm not going to name any names).


Wednesday, March 26, 2014

Scale invariance and the "fat tails" problem

A good deal of the statistical description of populations is based on the normal distribution. I think this is because the first things we tend to notice (the variability of sizes of people and animals) tend to have such a distribution. The height of Canadian men averages about 1.74 m, and the probability of variance typically follows a bell curve such that the probability of a man being 2.1 m tall, for instance, is much lower than the probability of being 2.0 m tall. There are well-established physiographic reasons for why people will not be much taller, (or very much shorter, discounting factors such as amputations), so that we can discount the existence of 3.5 m tall men.

One way of displaying the normal distribution was through a normal probability plot, which is a graph in which the vertical axis is scaled so that cumulative probability (for a normal distribution) will plot as a straight line. There is special graph paper you can use, with an appropriately scaled vertical axis, variably called probability paper, or probability plotting paper (pdf). A description of its use with data appears here (pdf).

If we are looking at natural phenomena with a wide variety, it is likely the distribution will be log-normal.

A normal distribution is described well by a mean and a standard deviation. If we plot probability density, we observe a parabola, with the maximum probability density corresponding to the mean.

The concept of the normal distribution was so powerful that we naturally carried the description to describe other phenomena, for which there are no such limits on size. Landslides, for instance, like the current one in Washington state, or earthquakes. Our current understanding of such events is that they exhibit scale invariance, which means that there are normally many more small events than large events, and the frequency of larger events is related to the frequency of the smaller events through their size on a logarithmic scale. In particular, the size-frequency distribution is a straight line on a logarithmic scale.


As the economic value shapes whether or not an accumulation of mineral is considered a deposit, mineral deposits only show scale invariance over a limited range. The numbers of, say 50-oz accumulations of gold in nature are extremely large, but these are very unlikely to be of economic interest. On the other hand, 50-million-ounce accumulations are much more rare, but are far more likely to be economically viable, and are thus more likely to constitute a "deposit". The size-distribution of deposits is controlled by these two contrasting probabilities, and the resulting distribution is log-hyperbolic. The probability density graph appears to be an hyperbola.


Hyperbola, parabola, what's the difference. Well, the differences are slight over much of the probability density plot, except at the tails. Of course, those tend to be the most memorable events (well, at the large tail).


Perhaps this doesn't look too impressive to you. But the differences in the tails can be extreme, especially for the most extreme events. The reason is that although the magnitudes of the slopes of both curves increases as you move away from the centre, in the case of the hyperbolic distribution, the maximum value of the slope approaches the slopes of the guiding lines (the asymptotes), whereas the slope of the parabola increases without limit. The discrepancy in estimated probabilities for extreme events can be orders of magnitude!

This is a possible explanation of the "fat-tails" problem that comes up from time to time in discussing extreme events (recent economic events for instance). IIRC, the failure of Long-term Capital Management had been estimated as extremely unlikely, as the risk model showed a maximum daily loss of $35 million. Losses eventually greatly exceeded the model maximum.

The implications of this distribution is happier for geologists--it means the probability of discovering a large deposit is larger than is frequently assumed.

For instance, this is from what appears to be a Shell-training document (large pdf) on the role of play-based exploration in the decision-making tree (image is on pg 45).


The straight line is the log-normal distribution fit to the observations (squares). The model fit predicts that only 1% of discoveries will be larger than 175.5 million barrels of oil equivalent--but the observed data suggests that about 1.5% of discoveries are greater than about 350 million barrels.

Using the model to estimate the probability of a large discovery probably satisfies the accountants as being nice and conservative, but considering the potential economic importance of individual large discoveries, using the incorrect probability model may create a significant opportunity cost, if it results in an area play being discarded incorrectly.

I know some folks in the oil industry--and they can be a cagey lot, especially about something that influences their business plan. So it wouldn't be unheard of for the above document (as it is publicly available) to be deliberate misinformation. I have made enquiries, but so far no one will admit to knowing what I'm talking about.

Anyway, the play-based exploration idea is something I alluded to last time--but I don't see this entering into the playbook for mining companies until the costs of failure for mining exploration more closely resembles that of petroleum exploration--something that I think is still a few decades away.

Saturday, March 22, 2014

Scale invariance of mineral wealth--the exploration conundrum

I was dreaming when I wrote this. Forgive me if it goes astray.
Part of the reason I started this blog was to work through some ideas. Writing them and seeking comment while they are still forming seems to be an ideal use of interweb pipes.

I have written here and here about scale invariance in gold deposits--mostly on a global scale, using various data sources (pdf), including this one (pdf). What to do with this information?

The most common question is "what is the largest gold deposit left to be discovered?" Unfortunately, the answer is probabilistic. There will be a fairly low probability that the largest gold deposit still to be discovered is larger than the largest found to date. A more meaningful question might be "what is the typical size of a gold deposit that remains to be found?" Nobody seems to be interested in that one. Typical deposits are for other people to find. They are going to find the largest one.

As above, so below. Given sufficient data, the analysis can be repeated for separate structural provinces, or for particular trends. At present, there is limited interest in this approach (pdfs), but it may be because it is not completely clear how to best use the information obtained by the analysis. Mining companies don't really make decisions to investigate a general area on these sort of criteria.

Presently, most mining companies decide to get ground on wholly different criteria. They select a commodity not necessarily based on their expertise, but because the market appears to favour it. They select a locality on the basis of its current popularity (bonus points for recent spectacular discovery), political stability, the ease (or cost) of acquiring properties, their personal interest/familiarity with the region, or the availability of infrastructure. Just check the websites of some junior mining companies.

Oil companies, on the other hand, use this type of data in a process called play-based exploration. "Play" refers to a prospective area, not what the geologists do. The idea is that through studying the distribution of the sizes of known oil deposits within a field, a company will estimate the probability of discovering a pool of oil of a given size, balance that against the probable losses accumulated during exploration, and decide whether or not to proceed. This is entirely different, and separate, from the analysis of any individual prospect within the play.

An analogy within the mining industry would be to estimate the typical size of a gold deposit in a place like Kazakhstan, and using that information to make a decision about whether or not to attempt to look for ground to acquire. The mining industry is not at that point, largely because the costs of failure are nowhere near as high as similar costs in the oil industry.

Oil companies went this route as the costs of dry holes escalated over the past few decades, and they began to lose money on plays, despite having success with individual prospects. 

Monday, March 17, 2014

Bernic Lake

I tried to be nice about this, but recent information about the unfolding situation at Tanco's Bernic Lake mine have really raised by ire.

Tanco has been mining caesium (pollucite) from under the lake. They had a permit that stipulated that they leave a certain thickness of rock (call it 'x') in support pillars, which hold up the roof of the mine (also the bottom of the lake). Presumably, company executives signed off on the specifications which led to the permit. Unfortunately, much of 'x' was ore, so the company began to extract it, with the result that the pillars are now smaller than originally proposed, and now are in danger of collapse (not my original source).

The original proposal was to drain a portion of the lake, block it off with a coffer dam, extract the remaining ore, fill the hole, and refill the lake. Which to my mind was doable, and a brief review of some of the environmental impact statements from interested parties suggested that this could be managed (aspects of the original proposal may be accessed here).

The trouble is that draining the lake and managing its environmental consequences is potentially costly. So apparently the company is considering a different proposal, which has been described (I have not seen original engineering documents) as continuing the underground mining operations, replacing the supporting rock as it is mined with some engineered structure.

The main difference between the new plan and the original plan is that the new plan is considerably cheaper, but risks the lives of the miners (especially given the company's operating record). But what do the lives of miners mean when almighty dollars are at stake?

No doubt there are subtleties that I have missed as I have not seen the original documents--and if I look at it completely dispassionately, it looks possible. But here we come to the history of the company. Considering how it has operated in the past with respect to engineering plans, I suggest the authorities in Manitoba should tell Tanco to fuck off.

Update:

Otto has reminded me that I was remiss not to mention that Cabot Corp. is the parent company of Tanco.

Wednesday, March 12, 2014

Spring is in the air

At least according to Winnie-ther-Pooh.


Unfortunately, those of us north of the Tropic of Cancer have this.