
The internet is abuzz over what some claim to be the discovery of Atlantis, just off the west coast of Africa. This happens to be practically in my backyard.
Let's examine the evidence.

The overview map above comes from Google Earth, showing a region of the Atlantic Ocean west of Northwest Africa. The red boxes are my construction and show the location of the three images shown below. Image A is alleged to be Atlantis. The other two images show features which have not been commented upon by the discoverers of Atlantis.
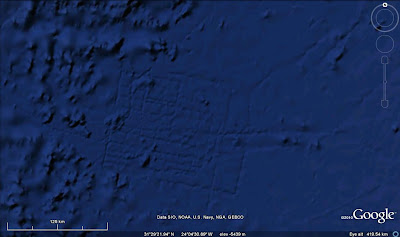
Image A. The area shows the transition from the area dominated by ridge/shear structures associated with the mid-Atlantic ridge (to the west of this image) to the area where such features have been blanketed by sediments. Apart from a few seamounts, the eastern half of this area is relatively featureless--except for that impressive looking series of orthogonal "roads" near the middle of the image.
The simple story is that these "roads" are an artifact of the process by which Google compiled (and then presented) existing data to create their interactive map of the earth. Google doesn't (yet) have marine vessels surveying the oceans, so it must rely on existing data. There are two principal data types--blanket satellite coverage of the oceans, where gravitational anomalies measured over long intervals are used to infer seafloor topography, and depth soundings by marine survey ships.
The satellite altimetry, produces very low resolution images. Features normally have to be spectacular in order to have enough of a gravitational effect to be teased out from ocean surface data (subtracting out the effects of waves and tides). The resolution obtained by a ship survey is easily an order of magnitude more detailed.
Now suppose you have an area of seafloor which is covered by relatively small hills and valleys--features which are too small to be resolved by the satellite image. These small features are easily detected by a surveying ship.

Here is part of a seismic profile collected many years ago using NSRFC's V-fin (neither of which exist anymore). This shows the seafloor as well as layers of sediment below the seafloor. The v-shaped notches in the seafloor are pockmarks, which are formed by methane gas escaping from beneath the seafloor, and the two largest pockmarks in this image are no more than 10 m deep. They are considerably wider, as this image has a vertical exaggeration of about 20x. (I would have used this image in my MSc thesis, but it is not close to hand at this writing, so I don't have the exact numbers).
The point is that a surveying vessel is capable of resolving an object that may be 10 m high and a few hundred metres across, whereas the satellite gravimeter needs an object to have kilometre scale.
Google does not present contoured data. What they do is create a model, which is then illuminated, and the sense of topography is created by the resulting shadows.
If a large area that is only covered by low-resolution satellite data, and which appears to be featureless is traversed by a survey line which resolves many small features--and then that data is all illuminated by some computer program, then what you will see is a featureless plain traversed by a single dark line. That line is too thin for you to resolve any of the features it shows you, but the artificially generated shadows will trace out the track of the ship.
Now let's look at some other areas of the seafloor.

Here is area B. Notice the "road" emanating from the seamount just east of centre to another seamount just beyond the northern limit of the image. Another set of "roadways" cover the western portion of the image. Those ancients sure were busy.

Area C shows a major highway stretching from Portugal towards Atlantis. Another "road" swings to the north.
The northern Atlantic Ocean isn't the only place covered by roads. Let's take a look at southern Africa.


There are a lot of roads leading to Cape Town. I don't know what was there, but it seems to have been of some importance.

Here is a patch of the Indian Ocean, covering a mid-ocean ridge between India and Sudan. Note the high relief, but there are lines of higher-resolution surveys which show up against the lower-resolution background satellite data.
Marine surveys have two common forms. The accidental surveys, like in the image immediately above, occur when ships leave their equipment running as they leave port. You end up with a lot of lines emanating from a major port. The other common form is an orthogonal grid.
Sad to say, the above looks like a survey. If I had to guess, I would suggest an ODP site survey.

Here is a different survey. If memory serves, this is John Hughes Clarke's SEAMARC survey.

More "roads" on the Nova Scotia continental slope. I actually helped make some of these, and there were no Atlanteans on the boat with me.

Besides, I thought Atlantis looked like this.
More on the Japanese discovery here.
Let's examine the evidence.

The overview map above comes from Google Earth, showing a region of the Atlantic Ocean west of Northwest Africa. The red boxes are my construction and show the location of the three images shown below. Image A is alleged to be Atlantis. The other two images show features which have not been commented upon by the discoverers of Atlantis.

Image A. The area shows the transition from the area dominated by ridge/shear structures associated with the mid-Atlantic ridge (to the west of this image) to the area where such features have been blanketed by sediments. Apart from a few seamounts, the eastern half of this area is relatively featureless--except for that impressive looking series of orthogonal "roads" near the middle of the image.
The simple story is that these "roads" are an artifact of the process by which Google compiled (and then presented) existing data to create their interactive map of the earth. Google doesn't (yet) have marine vessels surveying the oceans, so it must rely on existing data. There are two principal data types--blanket satellite coverage of the oceans, where gravitational anomalies measured over long intervals are used to infer seafloor topography, and depth soundings by marine survey ships.
The satellite altimetry, produces very low resolution images. Features normally have to be spectacular in order to have enough of a gravitational effect to be teased out from ocean surface data (subtracting out the effects of waves and tides). The resolution obtained by a ship survey is easily an order of magnitude more detailed.
Now suppose you have an area of seafloor which is covered by relatively small hills and valleys--features which are too small to be resolved by the satellite image. These small features are easily detected by a surveying ship.

Here is part of a seismic profile collected many years ago using NSRFC's V-fin (neither of which exist anymore). This shows the seafloor as well as layers of sediment below the seafloor. The v-shaped notches in the seafloor are pockmarks, which are formed by methane gas escaping from beneath the seafloor, and the two largest pockmarks in this image are no more than 10 m deep. They are considerably wider, as this image has a vertical exaggeration of about 20x. (I would have used this image in my MSc thesis, but it is not close to hand at this writing, so I don't have the exact numbers).
The point is that a surveying vessel is capable of resolving an object that may be 10 m high and a few hundred metres across, whereas the satellite gravimeter needs an object to have kilometre scale.
Google does not present contoured data. What they do is create a model, which is then illuminated, and the sense of topography is created by the resulting shadows.
If a large area that is only covered by low-resolution satellite data, and which appears to be featureless is traversed by a survey line which resolves many small features--and then that data is all illuminated by some computer program, then what you will see is a featureless plain traversed by a single dark line. That line is too thin for you to resolve any of the features it shows you, but the artificially generated shadows will trace out the track of the ship.
Now let's look at some other areas of the seafloor.

Here is area B. Notice the "road" emanating from the seamount just east of centre to another seamount just beyond the northern limit of the image. Another set of "roadways" cover the western portion of the image. Those ancients sure were busy.

Area C shows a major highway stretching from Portugal towards Atlantis. Another "road" swings to the north.
The northern Atlantic Ocean isn't the only place covered by roads. Let's take a look at southern Africa.

There are a lot of roads leading to Cape Town. I don't know what was there, but it seems to have been of some importance.

Here is a patch of the Indian Ocean, covering a mid-ocean ridge between India and Sudan. Note the high relief, but there are lines of higher-resolution surveys which show up against the lower-resolution background satellite data.
Marine surveys have two common forms. The accidental surveys, like in the image immediately above, occur when ships leave their equipment running as they leave port. You end up with a lot of lines emanating from a major port. The other common form is an orthogonal grid.
Sad to say, the above looks like a survey. If I had to guess, I would suggest an ODP site survey.

Here is a different survey. If memory serves, this is John Hughes Clarke's SEAMARC survey.

More "roads" on the Nova Scotia continental slope. I actually helped make some of these, and there were no Atlanteans on the boat with me.

Besides, I thought Atlantis looked like this.
More on the Japanese discovery here.


