
I have been working my way through a new paper by Ellison et al. (2012), from the same group that brought us epsilon machines.
In this paper the authors investigate systems which lie between those governed by classical mechanics (which are reversible, and both their past and future are easily divined from present observations assuming we know the equations of motion) and thermodynamic systems (the past of which, once in equilibrium, are fundamentally unknowable); which could be to say, systems which lie between physics (undergraduate, at any rate) and chemistry.
Systems for which our observations are incomplete, and which are characterized by extreme sensitivity to initial conditions are the focus of the paper. These systems are stochastic.
At this my ears (or maybe my eyes) perk up--we have been looking at just these sort of systems in the course of this blog.
The key insight in the paper is the potential for irreversibility in such systems. Irreversibility, in this case, means that the computational effort of prediction (forecasting the future) and retrodiction (modelling the past) are not equivalent. For these systems, it is insufficient to characterize the forward time-evolution of the system--one must also characterize the backward time-evolution as well; otherwise its description is incomplete.
These characterizations are built through Markov chain analysis, leading to an epsilon-machine construction. A reversible process is one in which both the forward-evolving and backward-evolving epsilon machines are identical.
In an earlier post, I constructed epsilon machines for early Quaternary paleoclimates using as predictive states the high-probability ice volumes A1, A2, and A3, from probability density plots like the one below:
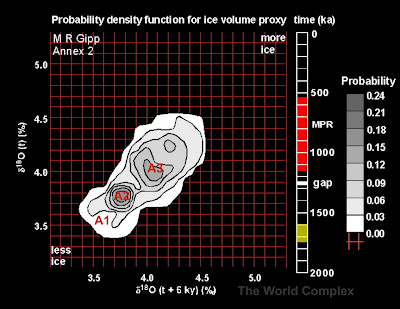
In the above diagram, A1 represents an interglacial condition (much less ice than at present), A2 was an intermediate glacial condition (comparable to what we call an interglacial state today), and the maximal glacial state A3, which here in the late Quaternary would only be considered a mild glacial state.

These states were defined from the probability density plots of reconstructed phase spaces way back when I was still using a window of length 270 ky. More recently I have reconstructed phase space for global ice volume with a window length of only 150 ky, but haven't transcribed all the state changes yet.
In retrospect, I could have placed the border between α1 and α2 in a different place than I did in the figure above. As a demonstration, I shall leave things as they are.
Of the three epsilon machines depicted, α2 and α3 are reversible, whereas α1 is not. The sequence of states in α1 was as follows: A2-A3-A1-A3-A2-A3-A2-A3-A2-A1. The probability computed for the arrow from A2 to A3 is the probability that A3 occurs given A2; which we find by observing all occurrences of A2 (4) and counting the number of them that are immediately followed by A3 (3), for a probability of 0.75. The other probabilities are calculated in a similar fashion.
To time-reversed epsilon machine is constructed the same way, but with the states in reverse order: A1-A2-A3-A2-A3-A2-A3-A1-A3-A2. The structure will appear to be the same, but the probabilities of each transition will differ.

The tilde (~) over the α1 tells us that this is the time-reversed epsilon machine. We note that it is not the same as α1.
The Mid-Quaternary epsilon machine appears to be irreversible.


The general structure of the forward and time-reversed version of α4 are similar. The Markov chain was short, beginning with A1 and ending with A4. The reversed version, therefore, has one more A4 and one less A1 than the forward version, and it is this difference that explains the changes in probabilities for the different transitions. Hence, α4 may actually be reversible.
The late Quaternary epsilon machine appears to be irreversible.


We recognize these as being irreversible because the backward evolving epsilon machine is different.
The goal is to then combine the forward and reverse models into a single bidirectional model (Crutchfield et al., 2009; Ellison et al., 2009). I haven't figured out how to do that yet.
Consider for a moment the reconstructed phase space portrait for the Case-Shiller index of house prices.

Defining causal states by a similar process as for the global ice volume proxy, we would see something like "BAB?"--with the question mark referring to the ongoing excursion generated by our friends at the Federal Reserve. It isn't really a long enough string to do any interesting Markov chain analysis or to construct an epsilon machine. We just haven't seen enough Fed intervention* to devise a predictive model.
Well, my homework now is to figure out the business of constructing the bidirectional model, and how to calculate the difference in entropy between the forward and backward process.
*On the other hand, I think we have already seen quite enough.
References
Crutchfield, J. P., C. J. Ellison, and J. R. Mahoney. Time's barbed arrow: Irreversibility, crypticity, and
stored information. Phys. Rev. Lett., 103(9):094-101, 2009.
Ellison, C. J., J. R. Mahoney, and J. P. Crutchfield. Prediction, retrodiction, and the amount of information
stored in the present. J. Stat. Phys., 136(6):1005-1034, 2009.
In this paper the authors investigate systems which lie between those governed by classical mechanics (which are reversible, and both their past and future are easily divined from present observations assuming we know the equations of motion) and thermodynamic systems (the past of which, once in equilibrium, are fundamentally unknowable); which could be to say, systems which lie between physics (undergraduate, at any rate) and chemistry.
Systems for which our observations are incomplete, and which are characterized by extreme sensitivity to initial conditions are the focus of the paper. These systems are stochastic.
At this my ears (or maybe my eyes) perk up--we have been looking at just these sort of systems in the course of this blog.
The key insight in the paper is the potential for irreversibility in such systems. Irreversibility, in this case, means that the computational effort of prediction (forecasting the future) and retrodiction (modelling the past) are not equivalent. For these systems, it is insufficient to characterize the forward time-evolution of the system--one must also characterize the backward time-evolution as well; otherwise its description is incomplete.
These characterizations are built through Markov chain analysis, leading to an epsilon-machine construction. A reversible process is one in which both the forward-evolving and backward-evolving epsilon machines are identical.
In an earlier post, I constructed epsilon machines for early Quaternary paleoclimates using as predictive states the high-probability ice volumes A1, A2, and A3, from probability density plots like the one below:

Probability density for reconstructed phase space portrait of global ice
volume proxy from 1700 to 1550 ka.
In the above diagram, A1 represents an interglacial condition (much less ice than at present), A2 was an intermediate glacial condition (comparable to what we call an interglacial state today), and the maximal glacial state A3, which here in the late Quaternary would only be considered a mild glacial state.

These states were defined from the probability density plots of reconstructed phase spaces way back when I was still using a window of length 270 ky. More recently I have reconstructed phase space for global ice volume with a window length of only 150 ky, but haven't transcribed all the state changes yet.
In retrospect, I could have placed the border between α1 and α2 in a different place than I did in the figure above. As a demonstration, I shall leave things as they are.
Of the three epsilon machines depicted, α2 and α3 are reversible, whereas α1 is not. The sequence of states in α1 was as follows: A2-A3-A1-A3-A2-A3-A2-A3-A2-A1. The probability computed for the arrow from A2 to A3 is the probability that A3 occurs given A2; which we find by observing all occurrences of A2 (4) and counting the number of them that are immediately followed by A3 (3), for a probability of 0.75. The other probabilities are calculated in a similar fashion.
To time-reversed epsilon machine is constructed the same way, but with the states in reverse order: A1-A2-A3-A2-A3-A2-A3-A1-A3-A2. The structure will appear to be the same, but the probabilities of each transition will differ.

The tilde (~) over the α1 tells us that this is the time-reversed epsilon machine. We note that it is not the same as α1.
The Mid-Quaternary epsilon machine appears to be irreversible.


The general structure of the forward and time-reversed version of α4 are similar. The Markov chain was short, beginning with A1 and ending with A4. The reversed version, therefore, has one more A4 and one less A1 than the forward version, and it is this difference that explains the changes in probabilities for the different transitions. Hence, α4 may actually be reversible.
The late Quaternary epsilon machine appears to be irreversible.


We recognize these as being irreversible because the backward evolving epsilon machine is different.
The goal is to then combine the forward and reverse models into a single bidirectional model (Crutchfield et al., 2009; Ellison et al., 2009). I haven't figured out how to do that yet.
Consider for a moment the reconstructed phase space portrait for the Case-Shiller index of house prices.

Defining causal states by a similar process as for the global ice volume proxy, we would see something like "BAB?"--with the question mark referring to the ongoing excursion generated by our friends at the Federal Reserve. It isn't really a long enough string to do any interesting Markov chain analysis or to construct an epsilon machine. We just haven't seen enough Fed intervention* to devise a predictive model.
Well, my homework now is to figure out the business of constructing the bidirectional model, and how to calculate the difference in entropy between the forward and backward process.
*On the other hand, I think we have already seen quite enough.
References
Crutchfield, J. P., C. J. Ellison, and J. R. Mahoney. Time's barbed arrow: Irreversibility, crypticity, and
stored information. Phys. Rev. Lett., 103(9):094-101, 2009.
Ellison, C. J., J. R. Mahoney, and J. P. Crutchfield. Prediction, retrodiction, and the amount of information
stored in the present. J. Stat. Phys., 136(6):1005-1034, 2009.
Ellison, C. J., J. R. Mahoney, R. G. James, et al., 2012. Information symmetries in irreversible processes. on arxiv (waiting for official publication)


